Categories
By ChartExpo Content Team
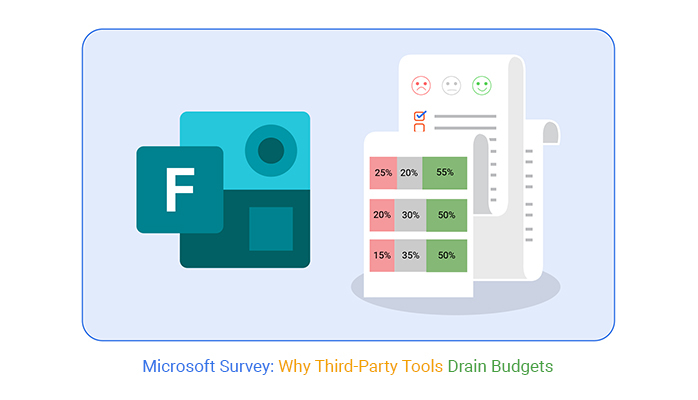
You’re probably paying for survey tools you don’t need.
The Microsoft survey is already in your Microsoft 365 subscription, yet many businesses skip it. Instead, they buy third-party tools, draining budget and time. This isn’t a small leak; it’s a flood of wasted money, missed insights, and extra risks.
The Microsoft survey connects directly with tools you already use, like Teams, Outlook, and Power BI. Ignoring it means more delays, more manual work, and slower decisions. Every minute spent exporting data to Excel or juggling separate apps is a step behind.
By sticking with third-party survey tools, you risk compliance issues. You scatter data across platforms, opening the door to privacy risks and legal trouble. The Microsoft survey keeps data in the ecosystem your business already trusts.
Why keep paying twice? The Microsoft survey is ready to collect feedback, update customer profiles, and give you real-time insights. Stop wasting budget. Start making smarter moves.
Microsoft survey tools are more than meets the eye, yet they’re often seen as mere form creators. This oversight can lead to inefficiencies and missed insights. Imagine a scenario where your team struggles with integrating survey data from disparate sources, wasting time and resources. All the while, the solution was right under your nose, sitting unused within your existing Microsoft suite.
Ignoring these tools is like overlooking a Swiss army knife in a survival kit. They’re designed to seamlessly integrate with other Microsoft products, providing a comprehensive view of data and enhancing decision-making capabilities. The misunderstanding doesn’t just cost money; it leads to missed opportunities for innovation and growth. It’s time to shift perspectives and recognize the value these tools can bring to your organization.
Power BI and Customer Voice are the dynamic duo you didn’t know you had. They’re nestled within your Microsoft 365 subscription, ready to transform how you gather and analyze data. Imagine having the ability to visualize customer feedback in real-time, spotting trends before they become issues. These tools aren’t just sitting there for show; they’re waiting to be put to work.
The real kicker? You’re likely paying for third-party tools to do what Power BI and Customer Voice can do, sometimes better. It’s not just about cost savings; it’s about harnessing the existing power of the Microsoft ecosystem. When you tap into these tools, you unlock the full potential of data-driven insights, making you not just efficient but also effective in decision-making.
Businesses often find themselves in a dilemma: paying for third-party survey tools while Microsoft’s solutions lie unused. This duplication not only wastes money but also resources. Think of it like buying a new gadget every time you need a screwdriver, ignoring the toolbox sitting in your garage. It’s inefficient and costly.
The financial implications of ignoring these built-in tools are significant. Organizations spend thousands on external survey solutions, unaware that their Microsoft 365 subscription already covers these needs. By not utilizing these resources, companies aren’t just losing money; they’re losing the chance to streamline processes and enhance productivity. It’s time to reassess and make the most of what you already have.
Financial inefficiency often lurks where you least expect it. Organizations often double their expenses by opting for external survey tools when their Microsoft 365 subscription already offers them. This isn’t about trimming a little fat; it’s about stopping a financial hemorrhage. When budgets are tight and every dollar counts, why pay twice for something you already own? Integrating these tools can save a fortune and streamline processes.
Ever been in a meeting where no one’s on the same page? That’s the procurement process for survey tools. IT and finance departments often operate in silos, each making decisions without consulting the other. It leads to purchasing redundant tools and inflating costs. Imagine bridging this gap; how much simpler and more cost-effective things would be. A unified approach can cut down unnecessary expenses and foster collaboration.
Data privacy is more than a buzzword; it’s a necessity. Using third-party survey tools can expose businesses to compliance risks, especially with regulations like GDPR looming large. Microsoft provides secure, compliant alternatives, ensuring data stays safe and legal issues remain at bay. Companies should weigh the potential legal fallout of external tools against the security of sticking with trusted resources.
CFOs, it’s audit time. Not for tax season, but for your software services. Overlapping subscriptions are a silent budget killer. Conducting a SaaS audit can unearth these redundancies, ensuring compliance and cutting unnecessary costs. Microsoft’s built-in survey features offer a strategic way to streamline operations. Understanding where your tools overlap can save money and enhance efficiency, making an audit a vital step.
The following video will help you create a Likert Scale Chart in Microsoft Excel.
The following video will help you create a Likert Scale Chart in Google Sheets.
The following video will help you create a Likert Scale Chart in Microsoft Power BI.
Sending Microsoft survey links through email or using external tools? That’s a trap. It creates bottlenecks and limits feedback collection. You end up with fragmented data and missed opportunities for actionable insights. Using these methods is like trying to fill a bucket with holes. The potential for feedback slips away, and you end up with a half-empty bucket.
Imagine receiving a survey link buried in your overflowing inbox. Chances are, it gets lost in the shuffle. The result? Limited responses, skewed data, and a lack of clarity. Instead, think about embedding surveys directly into platforms your team already uses. This eliminates friction and ensures your feedback pipeline flows smoothly, delivering real insights when you need them.
Embedding surveys directly within Teams, Outlook, or SharePoint is a game-changer. This move allows you to capture feedback right where the action is, no more hunting for survey links. It’s like placing a suggestion box right in the middle of a busy hallway. People notice it, use it, and you get real-time feedback that matters.
Success stories abound. Teams that switched to embedded surveys saw improved data flow and engagement. Employees appreciate the simplicity and immediacy. It’s a win-win situation; your team feels heard, and you gather insights that drive decisions. This simple shift boosts efficiency and keeps your feedback loop humming along nicely.
Using external tools often means delayed feedback analysis. By the time you get around to it, the moment has passed. Important trends are missed, and decisions are based on outdated data. It’s like trying to steer a ship while looking in the rear-view mirror. You’re always a step behind, missing the critical turn.
Real-time data flow changes the game. By embedding surveys within Microsoft tools, feedback is collected and analyzed on the spot. Decisions are made with fresh insights, not yesterday’s news. The result? Timely, relevant actions that keep your business agile and responsive. This approach ensures you’re ahead of the curve, not scrambling to catch up.
When it comes to surveys, a generic look can stick out like a sore thumb. Sure, Microsoft surveys might seem “plain vanilla” at first glance. But let that be your brand’s image, and you might end up with a few raised eyebrows from your audience. In the world of customer interaction, every detail counts, and a survey is no exception.
A survey that doesn’t reflect your brand’s personality might feel off-putting to those who engage with it. It’s not just about slapping your logo on it. It’s about conveying your brand’s voice, even in the questions you ask. Your audience should feel like it’s conversing with you, not just filling out another form. The more your survey feels like an extension of your brand, the more genuine and thoughtful the feedback you’ll receive.
Enter PowerApps and SharePoint, your brand’s best allies in maintaining that polished image without sacrificing security. By embedding surveys into SharePoint sites or PowerApps, you not only keep them looking sharp but also ensure they’re secure. It’s like having a secret ingredient that keeps everything in line, without anyone noticing.
This approach also allows for a seamless user journey. Respondents remain within familiar interfaces, reducing friction. They can engage with your survey without worrying about data leaks or security breaches. It’s the kind of assurance that keeps your IT team happy and your brand image intact.
Balancing a professional look with compliance needs can feel like walking a tightrope. But with Microsoft’s ecosystem, it’s more like a well-paved path. You can maintain your brand’s identity while ticking all the necessary compliance boxes. It’s about finding that sweet spot where design meets regulation.
Using embedded solutions within this ecosystem means you can customize your surveys to match your brand, without stepping into risky territory. It’s like having your cake and eating it too. You get to keep your brand’s voice loud and clear while also ensuring everything is compliant and secure. No need to compromise when both can coexist harmoniously.
Let’s be real. Using Excel for survey data is like using a bicycle for a road trip. Sure, it works, but it’s slow and clunky. Excel’s great for static reports, but when it comes to dynamic analysis, it’s way behind. Exporting survey responses into Excel limits your ability to make quick decisions. Imagine waiting to see what’s going on with your customers because you’re stuck formatting cells. That’s a major roadblock in today’s fast-paced environment.
Think about it. You’re collecting data to make decisions, but by the time you’ve wrangled your Excel sheets, the moment’s gone. Excel’s not built for real-time insights, and using it this way means you’re missing out on valuable trends. You need tools that move as fast as your business. Excel’s great for some tasks, but using it for survey data is like trying to win a race with a flat tire. It’s time to rethink your approach.
Now, Power BI is where things get interesting. It’s the tool that takes your survey data and turns it into something you can use right now. Imagine seeing trends as they happen, thanks to interactive dashboards that update in real-time. It’s not just about pretty charts; it’s about making informed decisions that drive results.
Power BI gives you the ability to dive deep into your data without getting lost. It connects seamlessly with your survey data, providing a clear picture of what’s happening. You’ll see patterns and trends that were buried in those Excel sheets. No more waiting for reports. With Power BI, you get the insights you need when you need them, helping you stay ahead of the game.
Let’s talk about sentiment analysis. Azure’s AI capabilities are like having a superpower for understanding open-text responses. Think of all those open-ended survey answers you usually skip over. Azure analyzes them, giving you a real sense of what your customers are feeling. It’s not just data; it’s the voice of your customer, clear and direct.
Using Azure, you’re no longer guessing. It provides insights into customer sentiment that you’d otherwise miss. You’ll know what’s working and what’s not, based on real feedback. This isn’t just about knowing more; it’s about understanding better. With Azure, you’re turning customer sentiment into a tangible advantage, something you can act on.
Predictive analytics is like looking into a crystal ball, except it’s based on real data. By integrating survey data with machine learning models, you can start predicting trends like customer churn or satisfaction levels. It’s not about reacting to what happened yesterday; it’s about knowing what might happen tomorrow.
When you use predictive analytics, you’re not just collecting feedback; you’re setting the stage for future success. You’ll know what your customers might do next, allowing you to plan and act proactively. This insight is invaluable, turning your feedback process from a rear-view mirror into a forward-looking strategy. It’s about being prepared, not surprised.
Data governance might sound dull, but it’s the backbone of your data strategy. Using Microsoft’s tools like Dataverse and Dynamics 365 ensures your data stays secure and compliant while remaining accessible. These tools manage your data flow smoothly, without the legal headaches that come with mishandling information.
By keeping your data within Microsoft’s ecosystem, you’re not just ticking compliance boxes. You’re ensuring operational efficiency, too. It’s about having confidence that your data is safe and usable, without worrying about breaches or non-compliance. In a world where data is everything, governance isn’t just important; it’s essential. Keep your data protected and your operations running smoothly with Microsoft’s robust tools.
Manual processing is like wearing blinders. You’re slow, and you miss what’s right in front of you. The more time you spend on this outdated method, the more insights slip through your fingers. Errors creep in, and before you know it, your data’s as fresh as last week’s bread.
Speed is the name of the game. Automating your workflow shaves off those unnecessary hours. Get those insights while they’re hot, not when they’re cold leftovers. Cutting out the manual work means getting feedback that’s actionable, not just archival. It’s about making decisions in real-time, not after the fact.
Enter Power Automate, your new best friend in efficiency. This tool takes the grunt work out of data handling, making sure responses are sorted, stored, and ready for action. It’s like having a personal assistant who never sleeps, never makes mistakes, and always gets the job done.
With Power Automate, you can set up workflows that handle responses automatically. Forget about tedious manual data entry. Instead, focus on analyzing the data and making decisions that matter. By automating this process, you’re not just saving time; you’re regaining control. It’s a game-changer in how you handle feedback.
Dynamics 365 integration keeps your customer profiles as fresh as the morning news. This integration ensures that every piece of feedback is updated instantly. It’s like having a living, breathing database that evolves with each customer interaction.
Forget about stale data. With real-time updates, your customer profiles reflect the latest insights. This means better decisions, faster responses, and happier customers. When feedback flows seamlessly into Dynamics 365, you’re not just keeping up; you’re staying ahead.
Manual data entry is madness, pure and simple. It’s time-consuming, error-prone, and utterly avoidable. SharePoint automation is your ticket out of this quagmire. It ensures data collection and logging happen automatically, without the need for constant oversight.
Imagine a world where data flows smoothly, where updates happen without a hitch. SharePoint automation makes this a reality. By cutting out the manual middleman, you ensure your data is always accurate and up-to-date. It’s about working smarter, not harder, and letting technology handle the grunt work.
Automation is the future. Embrace it, and let your data work for you, not the other way around.
Ever been stuck waiting on IT to launch a simple survey? You’re not alone. Centralizing survey processes in IT departments often leads to unnecessary delays. It’s like waiting for paint to dry when you’re ready to roll. Other departments become frustrated, feeling like they’re caught in a never-ending cycle of requests and approvals. The delays aren’t just annoying; they can directly impact decision-making, slowing down the feedback loop and causing missed opportunities.
The bottleneck is real. IT teams, already swamped with other tasks, can’t prioritize surveys. They juggle too many priorities, making it hard to get a quick turnaround on survey-related tasks. This scenario leaves departments feeling powerless and dependent, waiting for their turn in the queue. It’s a classic case of too many cooks spoiling the broth, where everyone ends up hungry for insights that are stuck in limbo.
Imagine a world where business units manage their surveys. This isn’t about throwing IT under the bus; it’s about giving teams the tools they need to move fast. Enabling non-technical teams to handle surveys increases agility. They can tweak, launch, and analyze without waiting for IT. It’s about putting the power where the need is most urgent.
Faster feedback loops mean that insights come when they’re needed, not weeks later. With the right tools, teams can react to data in real time, making decisions based on current, relevant information. This autonomy doesn’t just speed things up; it boosts morale. Teams feel empowered and engaged, knowing they have the control to make things happen without unnecessary roadblocks.
Power BI templates are a game-changer for teams who want insights without IT’s involvement. These ready-to-use templates simplify data visualization, letting business units dive straight into analysis. No more waiting for IT to set up dashboards. With templates, teams can plug in their survey data and watch patterns emerge instantly.
This approach saves time and fosters independence. Teams can explore data, uncover trends, and make evidence-based decisions on the fly. It’s like having a personal data analyst, ready to reveal insights at a moment’s notice. When teams take control of their data, they move faster, avoid bottlenecks, and ultimately drive better outcomes for the organization.
Storing data in the wrong country can be like stepping into a legal minefield. One wrong move, and you’re dealing with legal complexities that could have been avoided. Companies often overlook data residency, thinking it’s a tech issue. But when the auditors come knocking, it’s a business-wide problem. The consequences are severe: fines, operational disruptions, and potentially losing client trust.
Imagine the chaos of being audited and realizing your survey data is stored in a region with conflicting laws. It’s not just about the legal penalties; it’s about the disruption to your business. You might have to pause operations, divert resources, and scramble to fix what should’ve been right from the start. And in some industries, this kind of disruption isn’t just inconvenient, it’s devastating.
Azure offers tools to address data residency challenges, ensuring your data is stored correctly. With Azure, you can choose where your data resides, keeping it within compliant regions. This is essential for adhering to regulations like GDPR or CCPA. Azure helps you navigate the maze of data laws, providing peace of mind that your information is where it needs to be.
The beauty of Azure lies in its flexibility. It allows businesses to manage data residency without a hitch. You can select the region that aligns with your compliance needs, minimizing risks. No more sleepless nights worrying about data audits. With Azure’s robust features, staying compliant is less of a headache, leaving you to focus on what truly matters: your business.
Data laws evolve faster than we’d like. One minute you’re compliant, the next you’re struggling to keep up. It’s not just about GDPR or CCPA. New regulations pop up regularly, each with its own set of rules. Staying compliant means keeping one eye on the law and the other on your data strategies. If you lag, the penalties are harsh, and the reputational damage is worse.
To keep pace with shifting regulations, businesses need to be proactive. This means regularly reviewing and updating data residency strategies. It’s about being ready for change, not reacting to it. Using Microsoft’s tools can help, offering features that adapt to evolving laws, ensuring your data residency remains compliant. It’s a game of constant vigilance and readiness, but one that’s necessary to avoid costly missteps.
Send a survey at 5 p.m. on a Friday, and you might as well have sent it into a black hole. People are packing up, not filling out forms. Timing mistakes like these are why many surveys end up being ignored. When you flood inboxes at inconvenient times, responses drop. It’s not about what you ask, but when you ask it.
Ever notice how some surveys just get lost? They hit at the wrong time, and no one’s interested. A mid-morning or early afternoon survey might be better received. It’s all about catching people when they’re ready to engage, not when they’re drowning in other tasks. Timing is everything in this game.
Micro surveys are the little secret that packs a punch. Short, quick questions that don’t take much time can work wonders. It’s like asking a friend a quick favor instead of a big commitment. People are more likely to give quick feedback when it doesn’t feel like a chore.
In Microsoft Teams, micro surveys can pop up right within your chat. Need a quick check-in on a project? A micro survey can do the trick without disrupting the flow. When surveys are short and to the point, people are more inclined to answer. They fit seamlessly into the day without causing a fuss.
Sending surveys right after a customer interaction can capture fresh feedback. Imagine this: A customer finishes a transaction, and a survey pops up asking about their experience. They’re more likely to respond when the interaction is still fresh in their mind.
Automate these surveys to go out at the perfect time. After a support call or a purchase, strike while the iron is hot. This real-time feedback is valuable, giving you insights when they’re most accurate. Waiting too long can mean forgotten details and skewed responses.
Ever been bombarded with too many surveys? It’s exhausting. Survey fatigue happens when people feel overwhelmed by too many requests for feedback. The key is to be selective. Choose your moments wisely and don’t bombard your audience.
Target the right participants and limit how often you reach out. Quality over quantity should be the guiding principle. When you ask less frequently, each survey feels more valued. It’s about making your audience feel heard, not burdened.
It’s easy to overlook what’s already in your toolbox. Many teams spend time and money on survey tools without realizing their Microsoft 365 subscription covers the same needs. This habit leads to wasted budget, delayed feedback, and scattered data.
The tools inside your subscription are ready to use. Power BI, Customer Voice, and Teams can collect feedback, track sentiment, and connect data directly to where decisions happen. There’s no reason to export survey results to Excel and wait days to find insights.
Skip the extra costs. Skip the delays. The Microsoft survey features you’re paying for are already built to keep your feedback process sharp and your data moving.
If you’re paying twice for surveys, the real waste isn’t the money. It’s the time you’ll never get back.
How much did you enjoy this article?


Google Forms to Google Sheets keeps your data organized and current with every submission. Learn the steps, methods, and tips now!

Product survey questions reveal what customers truly think. Learn how to ask the right ones and act on the survey results. Read on!

Learn how the 5-Point Performance Rating Scale improves employee evaluations with clear, consistent, and fair performance reviews across teams.


