Categories
By ChartExpo Content Team
A dot plot is simple on the surface. Each dot shows a value. But one mistake, poor scale, bad layout, wrong sorting, and you mislead everyone. A dot plot can clarify or confuse. There’s no middle ground.
A dot plot can help leaders spot risk, compare outcomes, or catch false patterns. But it has to be built with care. You need the right layout, the right order, and the right context. Otherwise, it’s noise.
Used right, a dot plot can replace ten cluttered slides with one sharp chart. Used wrong, it sends your message off a cliff. Let’s make sure yours lands.
Ever had a meeting where things went sideways because someone saw something you didn’t? It happens. A dot plot can be your worst enemy. Stakeholders have a knack for spotting trends that don’t exist. Suddenly, you find yourself defending against ghosts. Those dots? They tell stories that aren’t there, and you’re left scrambling to reclaim control of the narrative.
You think it’s clear. You’ve laid out your data, expecting everyone to see what you see. But cognitive bias sneaks in. People connect dots in ways you never intended. It’s like a Rorschach test. They find patterns that flip the script on you. Yesterday’s hero, today’s culprit. The narrative against you builds, and you didn’t even see it coming.
The axis is set, the math checks out, and you’re feeling confident. But hold on. If the perception’s off, you’re in trouble. Executives see a distorted view, and suddenly, your credibility is at stake. It doesn’t matter how accurate your calculations are. Trust can vanish in a heartbeat if the visuals mislead.
Real consequences follow. Lose the room once, and you’re fighting an uphill battle to regain footing. Someone once lost a big contract because the axis range made things look worse than they were. It’s not just numbers; it’s perception. If it’s not right, you’ll find yourself explaining instead of leading.
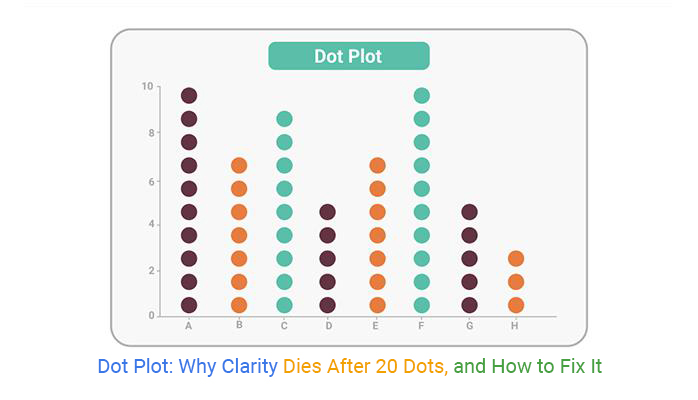
There’s a magic number. Twenty. Go beyond that, and you might as well be talking to yourself. Executives stop parsing, and their eyes glaze over. You’re left with a plot that closes the door to engagement. Fewer dots mean more focus. More dots? They nod through it, but there’s no buy-in. You’re speaking, but they’ve stopped listening.
False confidence in a cluttered plot leads to lost budgets and eroded influence. You’ll hear it in the silence, see it in the hurried glances at watches. You notice signs. Averted eyes, quick shifts in chairs. They’re bailing, and you’re left holding a plot that failed to deliver.
Without setting the scene, you’re inviting chaos. Before you showcase any visuals, tell them what to expect. Anchor the audience with a clear narrative. Start with, “Here’s what this chart reveals…” or “Focus on the trend in Q3…”. Your words are the map. Without them, the viewer’s interpretation wanders off course.
Miss the chance to frame, and you’ve lost control. The story gets hijacked by assumptions. Preempt this by defining the key takeaway upfront. It’s like giving them a lens to view the data. This isn’t just about data; it’s about steering perception.
Visual cues are your silent narrators. Use them wisely. Stick to three types: size, color, and sequence. Anything more and you’re setting them on a wild goose chase. Too many cues? That’s when you lose them to confusion and chaos.
Think of successful presentations you’ve seen. The ones where you knew exactly where to look. They didn’t overwhelm you. They guided you gently, like a spotlight on stage. A well-placed color or size difference shows them where the magic is happening. It keeps the eye where you want it.
Before you go live, test your plot. Show it to three colleagues, and give them three minutes. Can they all draw the same insight? If not, it’s back to the drawing board. This test reveals clarity, or the lack of it.
Visuals need to speak for themselves. If three sharp minds can’t see the same story, how will a room full of skeptics? It’s a quick check, but it saves you from a world of trouble. Clarity isn’t optional; it’s essential for survival.
Start with labeling everything. Yes, everything. See how it feels. Then, pull back. Keep the essentials: box plot outliers, axes, and callouts. The rest is clutter. Clutter confuses, clarity convinces.
This is surgical. You’re trimming the fat, leaving only what’s vital. Think of it as editing a story. You want the main plot points, not every minor detail. Prioritize, simplify, and watch how much easier it becomes for everyone to follow.
The following video will help you create an Excel Dot Plot.
The following video will help you create a Dot Plot in Google Sheets.
Ever had that moment when you’re presenting, and suddenly everyone’s squinting at the screen? Yeah, that’s what uneven spacing does. It tricks the eye into seeing patterns that aren’t there. You end up with phantom clusters that confuse more than they clarify. Auditing space is your best friend here. Measure those gaps. Make sure they’re even. If not, replot until what you see matches what’s real.
Don’t let spacing sabotage you. It’s like showing up to a meeting with mismatched shoes. People notice, and not in a good way. When dots are too close together, they scream for attention, often for the wrong reasons. Spread them out evenly. A clean plot speaks for itself; no need for explanations. Keep it honest, and your data will too.
Axis scaling can be your downfall if not handled with care. It’s one of those things where even if you’re innocent, you’ll look guilty. A weird scale can make data look exaggerated or downplayed. Stick to a straightforward scaling protocol. Keep it consistent across all visuals. If you change it up, someone will call you out, and you don’t want that.
Think of axis scaling like a handshake. Too limp, and it’s awkward. Too firm, and it’s overbearing. Find that sweet spot. Use a scale that reflects the true story of your data. If the numbers are tight, don’t stretch them out. If they’re spread, don’t squash them. The right scale keeps you out of the spotlight for the wrong reasons.
Outliers are like the elephant in the room. You might think ignoring them makes them go away, but they don’t. Senior leadership will zero in on these anomalies faster than you think. Highlight them, but don’t derail the conversation. Acknowledge their presence upfront. It shows you’ve done your homework and aren’t hiding anything.
Facing outliers head-on turns potential embarrassment into an asset. You control the narrative, rather than letting someone else twist it. Offer a quick explanation, then move on. It’s about owning the room and showing you’re on top of your data. Ignoring them only fuels suspicion. Transparency is your ally, so use it wisely.
Picture this: you’re in a meeting where every second counts. Dot plots? They’re like trying to read fine print on a speeding train. When time’s tight, people want clear, quick visuals. Think of settings like quarterly reviews or emergency strategy sessions. The room doesn’t have patience for deciphering data dots. Instead, bar charts offer a clearer snapshot, a straightforward view that gets straight to the point. Everyone can instantly grasp the highs and lows, the differences, without squinting.
Trying to use dot plots in these settings is like bringing a jigsaw puzzle to a sprint. The pieces might fit, but who has time to figure them out? Bar charts keep the focus on results. They show the big picture without the guesswork. Faster decisions, fewer headaches. Meetings where every minute counts demand visuals that say it all at a glance.
Not every situation calls for pinpoint precision. But when it does, dot plots shine. Consider regulatory reviews. Here, every detail matters. A dot plot’s nuance can highlight specific data points without losing the intricacies in a sea of information. Investors crave this level of detail when evaluating complex data sets. They need to see the subtle variations that could tip the balance of a decision.
Still, these scenarios are rare. Most of the time, people need speed. They want decisions that don’t require a magnifying glass. Use dot plots sparingly. When precision is the name of the game, they’re the right tool. But for everything else? Keep it simple. Stick to visuals that deliver clarity without a lecture on data interpretation.
Introducing a dot plot to an unaware audience is like speaking another language. You spend more time explaining than actually delivering insights. Visuals should enhance understanding, not create confusion. If your audience is new to these plots, consider some groundwork first. Offer a quick primer before the meeting. Make sure your audience knows what to look for, how to read it, and what insights they should gain.
Failing this, you’re stuck in a teaching mode, and the meeting loses its momentum. The key is making sure everyone’s on the same page. When your visual aids are unfamiliar, the risk is losing your audience’s attention altogether. Prepare them beforehand, and you’ll save everyone time and keep the focus where it belongs, on the data.
Executive decisions move fast. If a decision-maker can’t grasp your plot in 60 seconds, it’s a miss. The Executive 60 Rule is simple: if your visual doesn’t make immediate sense, it’s the wrong choice. Executives need clarity, not complexity. They’re juggling countless tasks and don’t have time to decipher complex data presentations.
If your dot plot takes longer to explain than the decision itself, you’re in trouble. Visuals should support quick, informed decisions. If they slow things down, reconsider your approach. The goal is to ensure your data supports the decision-making process without becoming a barrier. Speed and clarity win the day.
Ever stared at a plot and felt like your brain just short-circuited? That’s what happens when things get cluttered. Visual chaos is a meeting killer. If your plot’s a mess, nobody’s sticking around to decode it. Do a quick visual density check: if it takes more than a glance to see the story, it’s too dense. Trim it down.
Think of your plot like a highway sign. Clear, direct, and easy to read at a glance. If it’s got more dots than a pointillist painting, you’ve lost them. Strip it back until only the essentials remain. What you leave out is as crucial as what you keep in. If it looks like a connect-the-dots puzzle, you’re in trouble. Keep it simple so they stay engaged.
Ever been caught off guard by a question you should’ve seen coming? That’s a bad spot to be in. Anticipate the critiques. Know your plot’s weak points and prepare answers before they’re asked. Common critiques? Too many dots, unclear scales, or hidden data. Have your responses ready.
Imagine you’re prepping for a debate. You wouldn’t walk in without knowing the counterarguments. Pre-load those rebuttals. Turn potential critiques into strengths. If you’re ready with solid answers, you’re not scrambling when the heat’s on. Be the one who’s got it covered, not the one playing catch-up.
You know that moment when you realize you’ve missed something big? Don’t let that happen in front of others. Play the critic. Tear your plot apart before anyone else can. Pretend you’re the exec who’s grilling you. What questions would you ask? What holes would you spot?
Create a checklist of potential attacks. Are all points labeled clearly? Is the scale honest? Are the outliers obvious? Run through this list until there’s nothing left to question. It’s not about being paranoid; it’s about being prepared. This is your plot’s boot camp. If it survives, it’s ready for anything.
Ever smell something fishy and know something’s off? That’s what happens when a plot feels skewed. Inconsistent scaling or selective labeling? That’s a red flag. If it feels like you’re hiding something, trust me, they’ll sniff it out.
Your goal is transparency. If it feels off to you, it’ll feel worse to them. Be honest with your data presentation. Manipulation might seem like a shortcut, but it’s a fast track to losing trust. Keep it straight, keep it clear. If there’s even a hint of bias, start over. It’s not about avoiding mistakes; it’s about building credibility.
Time is tight. If your plot can’t be grasped in 90 seconds, it’s a problem. You’re not at a gallery; there’s no time to admire your work. If it’s not instantly clear, it’s not effective.
Think of it like an elevator pitch. You’ve got a minute and a half to make your point. If someone’s still deciphering what your plot means after that, you’ve lost them. Aim for clarity and speed. If it’s not there, rework it. You’re not looking for art; you’re looking for understanding. If it takes longer than 90 seconds, it’s back to the drawing board.
Organizing data isn’t just about neatness; it’s your secret weapon for guiding interpretation. The way you sequence data points can steer the narrative in your favor or leave it up to chance. Think of it like setting the stage for a play. If you don’t set the order, someone else will. And trust me, you don’t want them writing your script. Take control by leading with data that supports your key message, ensuring every dot aligns with the story you’re aiming to tell.
Now, imagine you’re sharing insights with your team. A well-ordered plot can make all the difference. It’s not just about what you present but how you present it. When dots follow a logical sequence, the audience can follow along with ease. It lets them see what you want them to see, without confusion. Your job is to make the dots connect in their minds before they start connecting the wrong ones on their own.
Visual styling can be a slippery slope. Sure, colors and sizes can add clarity, but overdo it, and you risk losing credibility. It’s about balance. Use color to highlight, not to distract. Size should signal importance, not overwhelm. Think of it as dressing for a meeting: enough to make an impression, not so much that they forget what you said.
Ever seen a plot that looked like a rainbow exploded? It might catch the eye, but not the right kind of attention. Too many colors or extreme contrasts can muddy the message. Please keep it simple, let the data speak. Your goal? Enhance clarity, not create chaos. The right visual touch can elevate a presentation from mundane to memorable, but it must always serve the story, not overshadow it.
Strategic annotation is your ally in dodging conversational landmines. When you anticipate potential pitfalls, call them out before they derail the discussion. Annotations should highlight risks and guide the reader’s focus. You’re not just presenting data; you’re navigating the narrative. Mark the spots that need explanation and steer the conversation where you want it to go.
Remember, every plot has its weak points. By annotating these, you prevent misunderstandings and maintain control. Think of annotations as breadcrumbs leading your audience through a complex maze. Each note should clarify, not confuse. When done right, your annotations become the silent guide, ensuring the audience gets the message without getting lost.
In quarterly exec reviews, time is tight. Nobody wants to sift through a maze of dots when crisp, clear insights are needed fast. If you roll in with one of these visuals, you might as well be handing out sleeping masks. Decision-makers demand streamlined data that jumps out, not a puzzle to solve. Go with bar charts or even a simple line graph. They cut to the chase instantly, leaving no room for misinterpretation.
You might think a complex visual shows depth, but here it just shows you’re out of touch. The room’s energy shifts, and not in your favor. The eyes of your audience glaze over, and you feel the room’s patience evaporate. Avoid this by sticking to visuals that summarize the data in a blink. Keep it simple, and you’ll keep them engaged.
In competitive briefs, clarity wins the day. When you’re up against rivals, every second counts. A cluttered visual can bury your key points. You need to convey strength and strategy without getting bogged down in the details. A pie chart or a simple table, or a scatter chart can make your point fast and clear. It’s about delivering a punch, not a paragraph.
Teams need to grasp the strategy quickly. If they have to decode your visuals, you’ve already lost them. Simple visuals keep your team on the same page. They understand the stakes and the plan without getting lost in the dots. Keep your visuals straightforward so the focus stays where it belongs, on beating the competition.
Finance teams crave precision and clarity. When forecasts are on the table, it’s about numbers, not art. A complex visual risk muddying the waters. You need everyone on board with the numbers, not distracted by trying to find them. Spreadsheets or basic graphs lay it all out without the frills. They’re all about the numbers, no room for confusion.
Your goal is to communicate, not complicate. When the stakes are high, don’t gamble on complex visuals. They can obscure the data instead of highlighting it. The team wants to see the numbers clearly, without distraction. Stick with straightforward visuals, and you’ll keep everyone’s trust intact.
Start with the conclusion. Your audience doesn’t want to play detective with your data. They want the answer, the bottom line. Lay it out clearly before you even think about showing the chart. This isn’t about showing off your data-crunching skills. It’s about delivering the insight, plain and simple.
Once you’ve hit them with the takeaway, then, and only then, do you bring in the visuals. This isn’t a show-and-tell; it’s a show-and-sell. The plot is there to support your conclusion, not to steal the spotlight. Keep it straightforward, and keep them focused on what matters.
Keep your audience hooked by controlling what they see and when. It’s like telling a story, revealing just enough to keep them interested. This isn’t about being mysterious; it’s about guiding their attention where you need it. Start with the big picture, then drill down to the details that matter.
Break it down into parts. This helps keep the focus sharp and prevents information overload. Each piece should build on the last, leading your audience to that “aha” moment. You’re not just sharing data; you’re crafting a narrative that leads to a decision.
Every point on your chart should earn its place. If you can’t explain a dot in ten seconds, it’s probably clutter. Each dot should tell a story, quickly. If it doesn’t, ditch it. This isn’t about having less data; it’s about having the right data.
Think of each point as a potential question from your audience. Can you answer it confidently and concisely? If not, it’s a distraction. Your goal is clarity, not confusion. Keep the plot tight and purposeful. Every dot should work for you, not against you.
Your data should always lead to an action. What do you want your audience to do with the information you’re giving them? Make it clear. Your plot should be a stepping stone to a decision or the next step, not just a pretty picture.
Link your conclusion directly to the action you need. Don’t leave it up to them to connect the dots; do it for them. Your message should be, “Here’s what we found, and here’s what we need to do.” It’s about driving change, not just sharing insights.
Many tutorials gloss over the real-world chaos of presenting data. They focus on the how-to, ignoring the why and when. The stakes are high when you present to a room full of decision-makers. You can’t afford a misstep that turns into a full-blown disaster. It’s not just about putting dots on a chart. It’s about knowing the room, the biases, and the narratives people will create before you even start speaking.
The reality is, most tutorials are written by people who haven’t had their work picked apart in a packed meeting. They don’t talk about what happens when someone questions your motives because a dot seems out of place. Or when a dot plot looks like a win to you but screams “incomplete” to someone else. That’s the stuff you only learn by being on the hot seat. You need tactics that come from experience, not theory. You need the kind of advice that helps you not just survive but thrive in the meeting room.
First impressions are everything. You’ve got a split second to make an impact when your plot hits the screen. If it looks too complex or too simple, you’ve lost them. The audience will decide in the first few seconds whether what you’re showing is worth their attention or another waste of time. It’s harsh, but true.
The way to win those seconds is by keeping it clean and direct. Use color and size to highlight what matters most. Don’t let them get lost in a sea of data points. Your job is to make their eyes go exactly where you want them to. If they start squinting, you’re done. If they see what you want them to see and get it instantly, you’ve won half the battle. It’s not just a plot, it’s your opening line, your handshake, your shot to captivate before questions start flying.
Before you even walk into that meeting room, you need to have run your plot through a filter. Think of it as a dress rehearsal for the data. Check for clarity first. Can someone understand the key message without you explaining it? If they can’t, it’s back to the drawing board. Then comes defensibility. Ask yourself if you can justify every choice in your plot. If someone asks why that dot is where it is, have an answer ready.
Perception is your final hurdle. Imagine you’re the most skeptical person in the room. Does the plot hold up? Or does it fall apart under scrutiny? If you’re confident it passes these filters, you’re ready. If not, don’t risk it. You’ll be better off reworking than getting caught off guard. This isn’t just about getting through the meeting. It’s about leaving with your credibility intact.
Ever tried to force a square peg into a round hole? That’s what it feels like when you misuse a dot plot. Not every dataset shines with this type of visualization. Think of a decision matrix as your guide. Start by asking, “Does the data need individual point emphasis?” If yes, this might be your tool. But if you’re drowning in dots, reconsider.
A matrix helps avoid those awkward meeting moments when you’re scrambling to explain why you chose a certain visual. It’s about clarity and relevance. If the plot leads to more questions than answers, it’s a sign to switch gears.
In such cases, simpler or more structured visual formats can even act as an alternative of Pie chart, especially when clarity and quick interpretation matter more than decorative representation. Consider alternatives when your matrix points to complexity without value.
Templates should speak for themselves. A clean, simple template can make all the difference. Begin with a standard layout. Ensure labels are clear. Prioritize crucial data points to minimize clutter. If someone needs a legend to decipher your plot, it’s time to rework.
Think of your audience. They want quick insights, not a puzzle. Templates are not about flair. They’re about delivering the message with precision. When done right, they save time and reduce confusion. Choose minimalism over bells and whistles for maximum impact.
You know that saying about teaching a person to fish? The same goes for visualization. Train your team well, and you’ll spend less time cleaning up their visual messes. It starts with the basics: what a plot can do versus what it can’t. Ensure everyone knows when and why to use certain visuals.
Set up regular training sessions. Share best practices and common pitfalls. Make this part of your team’s DNA. The goal is consistency, so everyone’s on the same page. When your team is skilled, the work they produce reflects it. And your cleanup days? Numbered.
The dot plot isn’t about flash. It’s about focus. It puts each data point where it needs to be, visible, honest, and ready for decisions.
But that clarity takes work. Your axis must make sense. Your layout must match the story. Your categories must speak in the right order. One missed step and the chart misleads.
Dot plots don’t fix your message. They reflect it. If your numbers are fuzzy, your chart will be too. If your story’s clear, the chart makes it faster to read.
Good dot plots do one thing well: they help people see.
Bad ones? They don’t stay quiet. They confuse, mislead, and waste time.
Build your dot plot like it matters, because it does.
How much did you enjoy this article?


Calculate accounts receivable turnover ratio to measure credit collection speed, improve cash flow, and strengthen your financial strategy. Read on!

Change Management KPIs are the key to tracking adoption, performance, and ROI during transitions. Find out which metrics matter. Read on!

Data collection methods and techniques determine the quality of every insight you act on. Explore key approaches for gathering reliable data. Read on!


