• Home
  • Tools dropdown img
    • Spreadsheet Charts

      • ChartExpo for Google Sheets
      • ChartExpo for Microsoft Excel
    • Power BI Charts

      • Power BI Custom Visuals by ChartExpo
    • Word Cloud

  • Charts dropdown img
    • Chart Category

      • Bar Charts
      • Circle Graphs
      • Column Charts
      • Combo Charts
      • Comparison Charts
      • Line Graphs
      • PPC Charts
      • Sentiment Analysis Charts
      • Survey Charts
    • Chart Type

      • Box and Whisker Plot
      • Clustered Bar Chart
      • Clustered Column Chart
      • Comparison Bar Chart
      • Control Chart
      • CSAT Survey Bar Chart
      • CSAT Survey Chart
      • Dot Plot Chart
      • Double Bar Graph
      • Funnel Chart
      • Gauge Chart
      • Likert Scale Chart
      • Matrix Chart
      • Multi Axis Line Chart
      • Overlapping Bar Chart
      • Pareto Chart
      • Radar Chart
      • Radial Bar Chart
      • Sankey Diagram
      • Scatter Plot Chart
      • Slope Chart
      • Sunburst Chart
      • Tornado Chart
      • Waterfall Chart
      • Word Cloud
    • Google Sheets
      Microsoft Excel
  • Services
  • Pricing
  • Contact us
  • Blog
  • Support dropdown img
      • Gallery
      • Videos
      • Contact us
      • FAQs
      • Resources
    • Please feel free to contact us

      atsupport@chartexpo.com

Categories
All Data Visualizations Data Analytics Surveys
Add-ons/
  • Google Sheets
  • Microsoft Excel
  • Power BI
All Data Visualizations Data Analytics Surveys
Add-ons
  • Google Sheets
  • Microsoft Excel
  • Power BI

We use cookies

This website uses cookies to provide better user experience and user's session management.
By continuing visiting this website you consent the use of these cookies.

Ok

ChartExpo Survey


Home > Blog > Google Sheets

Google Sheets HLOOKUP: A Simple Walkthrough

Why use Google Sheets HLOOKUP? Have you ever spent hours scrolling through rows of data? Then you know how frustrating it can be to find the right piece of information. Google Sheets HLOOKUP makes that faster—no more endless searching or wasted time.

Google Sheets HLOOKUP

Many rely on Google Sheets to manage projects, budgets, and reports. However, raw data is meaningless if you can’t analyze it quickly. That’s where Google Sheets HLOOKUP comes in. It scans rows, finds matches, and gives you results in seconds.

With Google Sheets functionality, you don’t need to be a data scientist. You need innovative tools, and functions like HLOOKUP do the heavy lifting. They keep your data clean and easy to use.

Think about what else you can do. You can remove duplicates in Google Sheets to tidy up messy sheets. Also, you can connect data from different files with IMPORTRANGE. These features save time and prevent errors.

Data should work for you. Not the other way around. So, don’t just scroll and guess. With a simple formula, you can bring clarity to chaos. Minor tweaks lead to bigger insights.

That’s the power of innovative formulas. Let’s see what HLOOKUP can do for you.

First…

Table of Contents:

  1. What is HLOOKUP in Google Sheets?
  2. Why Use Google Sheets HLOOKUP?
  3. What is the HLOOKUP Formula in Google Sheets?
  4. Practical Applications of HLOOKUP in Google Sheets
  5. How to Implement HLOOKUP in Google Sheets?
  6. How to Visualize the Data after Implementing HLOOKUP in Google Sheets?
  7. How to Use HLOOKUP in Google Sheets for Analysis?
  8. Tips for Using Google Sheets HLOOKUP
  9. Limitations of Google Sheets HLOOKUP
  10. FAQs
  11. Wrap Up

What is HLOOKUP in Google Sheets?

Definition: HLOOKUP in Google Sheets is a horizontal lookup function. It searches for a value in the top row of a table. Then it returns a value from a specified row below. It’s useful when your data is arranged in rows.

Unlike VLOOKUP for Google Sheets, which works vertically, HLOOKUP scans across columns. If your data is in a vertical format, use Google Sheets’ TRANSPOSE function first. This helps convert rows into columns.

HLOOKUP is great for simple row-based searches. Use it when the header row holds your lookup values. It’s a quick way to pull data from horizontal lists.

Why Use Google Sheets HLOOKUP?

Have you ever stared at a spreadsheet so big it makes your head spin? Google Sheets HLOOKUP can fix that. It’s a small formula with significant results. Combine it with IMPORTRANGE in Google Sheets and watch your scattered files work together.

Here’s why you need HLOOKUP.

  • Efficient data retrieval: HLOOKUP quickly searches through rows to find the exact data you need in seconds. No more scrolling or guessing where your numbers hide.
  • Saves time and reduces errors: Manual searches can lead to minor mistakes that can result in significant financial losses in the long run. Let HLOOKUP handle it so your results stay clean and quick.
  • Useful for row-based data structures: Wide spreadsheets with numerous categories require smart lookups. HLOOKUP scans rows from left to right, retrieving the correct value each time.
  • Supports exact and approximate matching: Sometimes you need an exact price or code. Other times, an estimate works — HLOOKUP does both without extra effort.
  • Ideal for dashboards and reports: Dashboards stay accurate when HLOOKUP fills in the data behind the scenes. Pair it with what-if analysis in Google Sheets to quickly test different scenarios.

What is the HLOOKUP Formula in Google Sheets?

Definition: The HLOOKUP formula in Google Sheets searches for a value in the top row of a table. Then, returns data from a specified row in the same column. To use this formula, type:

=HLOOKUP(search_key, range, row_index, [is_sorted])

  • The search key is what you’re looking for.
  • The range is where to look.
  • The row index indicates which row in Google Sheets to retrieve data from.

Use TRUE for an approximate match or FALSE for exact. Combine it with what-if analysis in Google Sheets to test potential outcomes.

Practical Applications of HLOOKUP in Google Sheets

Think HLOOKUP is only for data geeks? Think again. Google Sheets HLOOKUP helps everyone, from teachers to sales managers. It’s a quick fix for messy data and wasted hours. Here’s where it shines:

  • Student report cards: Teachers can use Google Sheets HLOOKUP to pull each student’s test scores from a giant gradebook in seconds. This means report cards are ready faster and mistakes are less likely.
  • Sales and financial reports: Sales managers rely on HLOOKUP to grab sales figures, discounts, or tax rates from wide tables. This ensures that financial summaries are accurate and readily available for quick decision-making.
  • Inventory management: Warehouse teams check stock by scanning rows of product IDs with HLOOKUP. Combine it with IMPORTRANGE in Google Sheets to update inventory from multiple sheets at once.
  • Dashboards and templates: Create dynamic dashboards that consistently display the latest numbers using the HLOOKUP function. Integrate Google Sheets’ artificial intelligence to automatically predict trends and spot insights.

How to Implement HLOOKUP in Google Sheets?

Want to stop digging through rows of endless data? Google Sheets HLOOKUP makes it easy to find precisely what you need in seconds. Here’s how to start:

  1. Pick your search key — the value you want to find. It could be a name, ID, or product code.
  2. Highlight the range where your data lives. Ensure your key is located in the first row of that range.
  3. Type =HLOOKUP(search_key, range, row_index, [is_sorted]). Press Enter and watch Google Sheets functionality do the work for you.

How to Visualize the Data after Implementing HLOOKUP in Google Sheets?

Data without visuals is like pizza without cheese—bland and forgettable. In data analysis, charts turn numbers into insights. Pretty charts matter when you want insights to pop. But here’s the catch: Google Sheets helps, but it often leaves you wanting more. It’s clunky, limited, and just not built for stunning visuals.

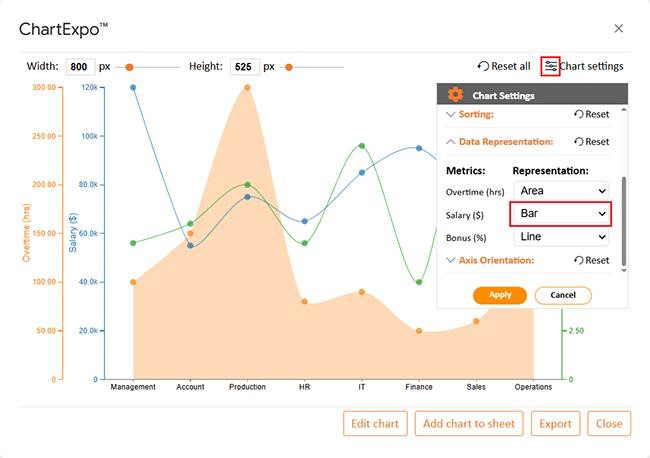
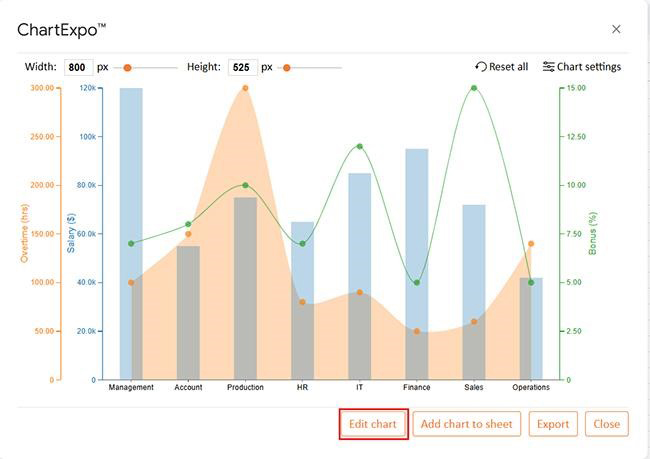
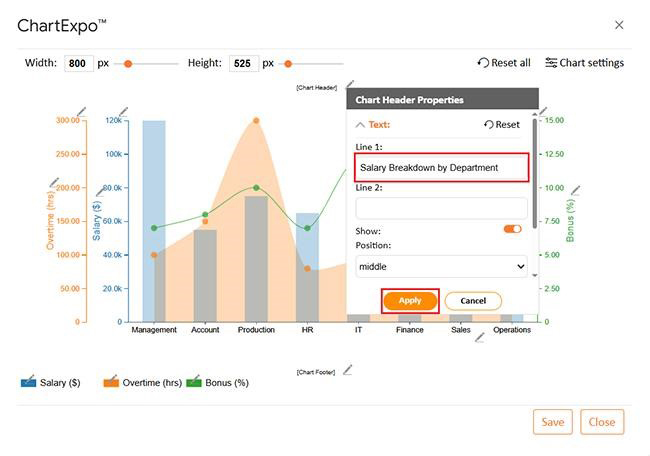
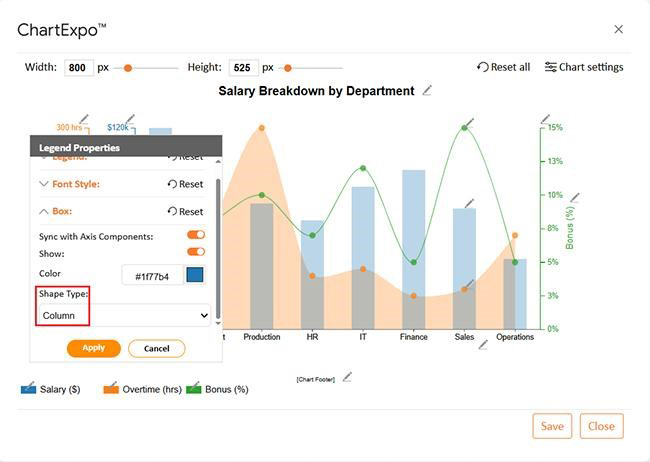
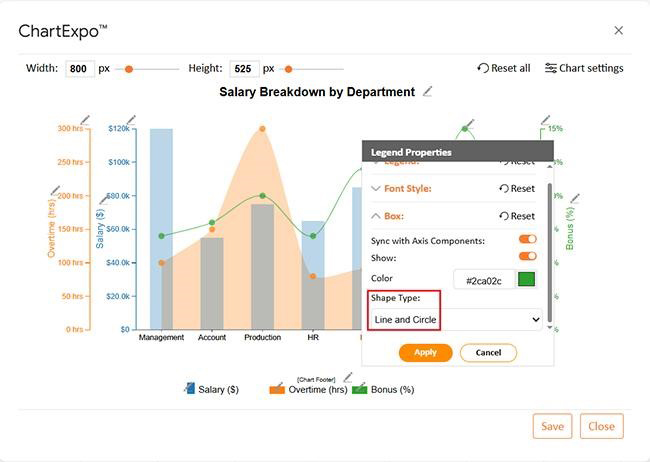
Even the smartest Google Sheets functionality, “HLOOKUP,” needs a boost sometimes, and that’s where ChartExpo steps in. ChartExpo turns dull tables into bright, clear visuals. Using ChartExpo with innovative formulas, such as HLOOKUP, makes your data do more than just sit there — it tells a story.

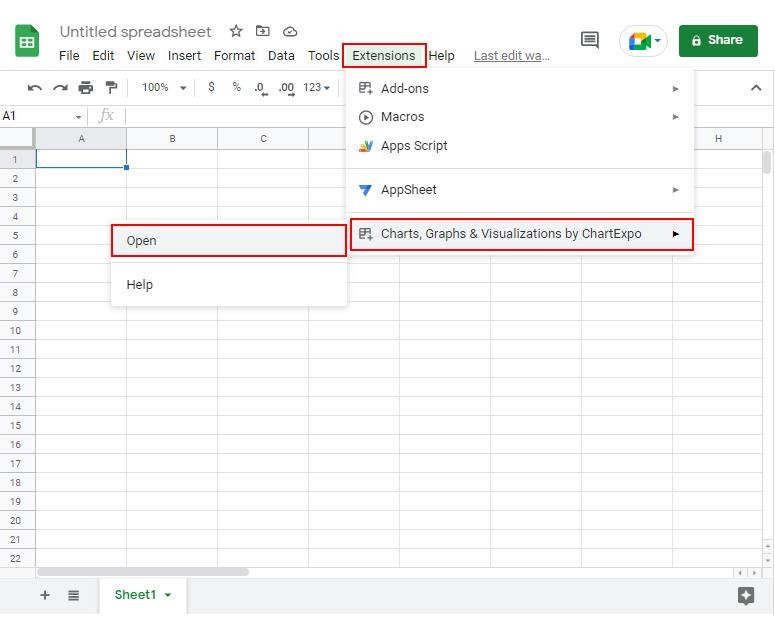
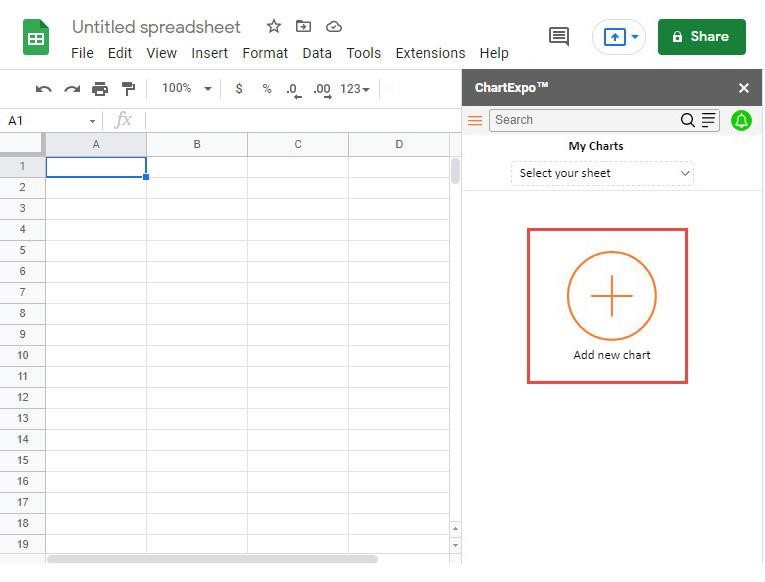
How to Install ChartExpo in Google Sheets?

  1. To start using ChartExpo, download it directly from the Google Sheets program. To do this, select Extensions from the top toolbar.
  2. A menu will appear. Click the Get add-ons option.
  3. Search for ChartExpo, and click on Charts, Graphs & Visualizations by ChartExpo when it appears in the results.
  4. Click the Install button. You will have to confirm your Google account and accept some permissions.

ChartExpo charts are available both in Google Sheets and Microsoft Excel. Please use the following CTAs to install the tool of your choice and create a beautiful visualization in a few clicks in your favorite tool.

Example

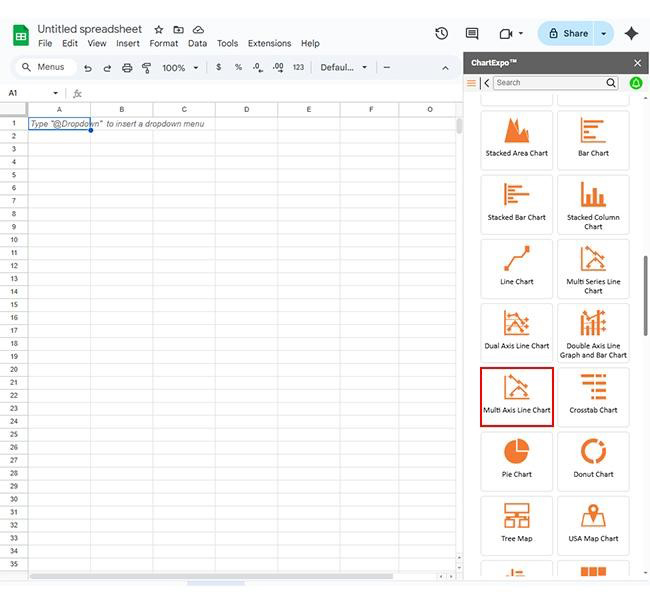
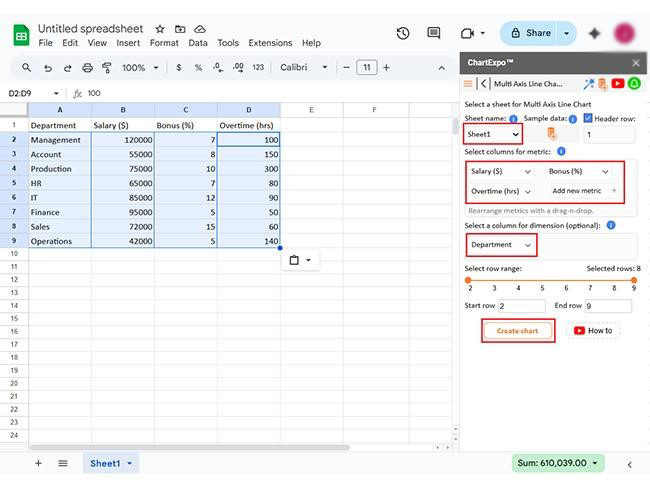
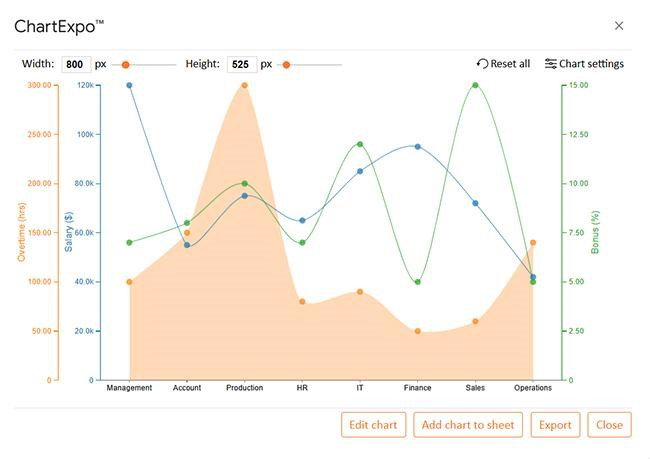
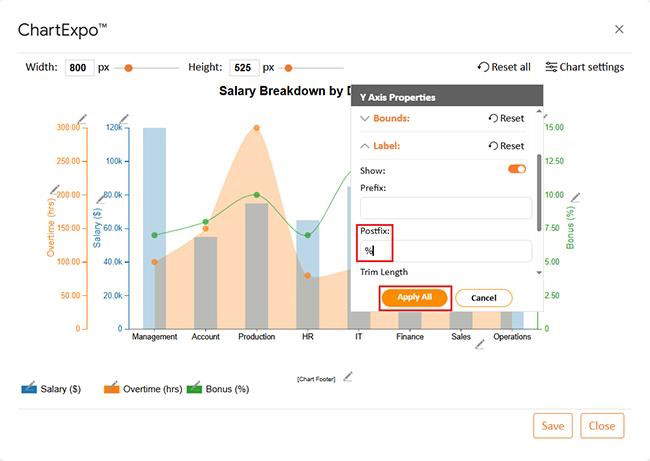
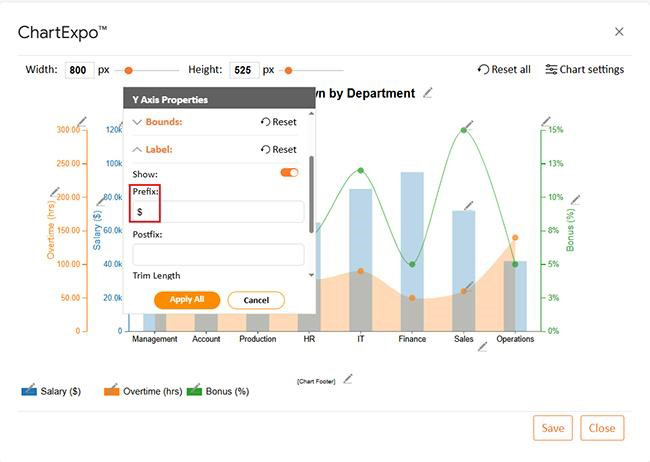
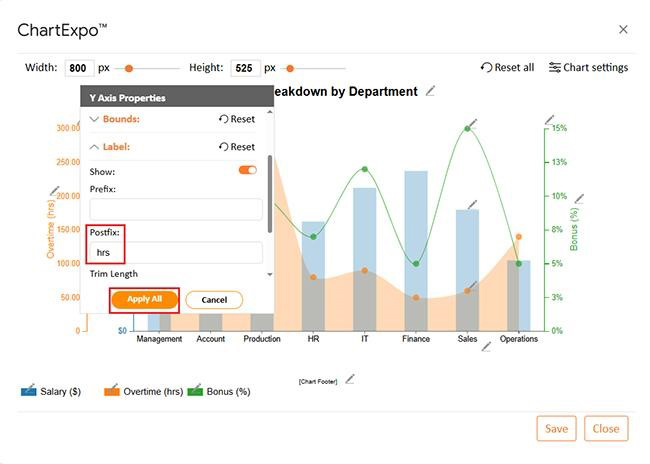
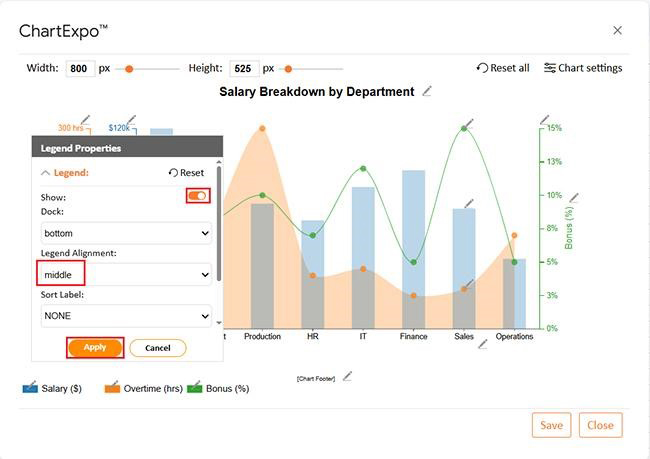
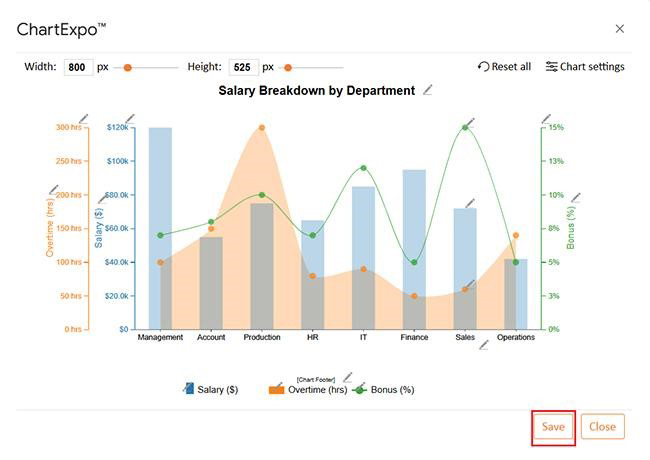
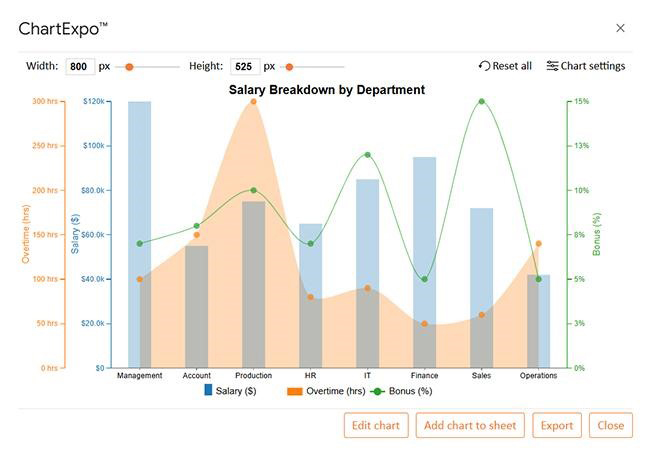
Let’s visualize and analyze this sample data in Google Sheets using ChartExpo.

Department Salary ($) Bonus (%) Overtime (hrs)
Management 120000 7 100
Account 55000 8 150
Production 75000 10 300
HR 65000 7 80
IT 85000 12 90
Finance 95000 5 50
Sales 72000 15 60
Operations 42000 5 140
  • To get started with ChartExpo, install ChartExpo in Google Sheets.
  • Go to Extensions > Charts, Graphs & Visualizations by ChartExpo > Open.
Google Sheets HLOOKUP
  • To access the charts library, click the Add new chart button.
Google Sheets HLOOKUP
  • Once it loads, scroll through the charts list to locate and choose the “Multi-Axis Line Chart”.
Google Sheets HLOOKUP
  • Put the data table in the sheet first. Then, choose the Sheet name from the drop-down in the ChartExpo section.
  • Select the metric column; metric is the numeric column in your data sheet.
  • Select the dimensions column; the dimension is the categorical column in your datasheet that contains text information.
  • Click the Create chart button to complete the process.
Google Sheets HLOOKUP
  • Your Multi Axis Line Chart will appear as shown below.
Google Sheets HLOOKUP
  • First, you can change the Data Representation by clicking on “Chart settings” as follows:
Google Sheets HLOOKUP
  • If you want to add anything to the chart, click the Edit Chart button:
Google Sheets HLOOKUP
  • Click the pencil icon next to the Chart Header to change the title.
  • It will open the properties dialog. Under the Text section, you can add a heading in Line 1 and enable Show.
  • Give the appropriate title of your chart and click the Apply button.
Google Sheets HLOOKUP
  • You can add the Percentage Sign (%) with all values and change the precision value to zero as follows:
Google Sheets HLOOKUP
  • You can add the dollar sign as follows:
Google Sheets HLOOKUP
  • Change the precision value to zero and add the “hrs” sign with overtime as follows:
Google Sheets HLOOKUP
  • Enable the legend button and align it in the middle as follows:
Google Sheets HLOOKUP
  • Change the legend shape of the Assignment Assigned into Column and click the “Apply” button:
Google Sheets HLOOKUP
  • Change the label shape of Primary Enrollment and Higher Ed Enrollment into “Line and Circle” and click the “Apply” button:
Google Sheets HLOOKUP
  • After making all changes, click the “Save” button as follows:
Google Sheets HLOOKUP
  • Your final Multi Axis Line Chart will look like the one below.
Google Sheets HLOOKUP

Insights

  • Management gets the highest base pay.
  • Operations have the lowest total pay.
  • Sales bring in the biggest bonuses.
  • Production racks up the most overtime.

How to Use HLOOKUP in Google Sheets for Analysis?

Ready to make Google Sheets HLOOKUP your secret weapon for more thoughtful analysis? Stop scrolling through endless rows and let your sheet do the heavy lifting. When you combine HLOOKUP with Google Sheets functionality, you get answers quickly and accurately. Here’s how to put it to work:

  1. Organize your data horizontally: Place your key data in the top row. Keep rows clear and tidy for better matches.
  2. Use the HLOOKUP formula: Type =HLOOKUP() with your search key, range, and row index. Double-check for an exact or approximate match.
  3. Combine with other functions: Pair HLOOKUP with IMPORTRANGE in Google Sheets to pull data from multiple files. Don’t stop there. Use what-if analysis in Google Sheets to instantly test outcomes.
  4. Create interactive dashboards: Use drop-downs and HLOOKUP for dynamic reports. Share your results by learning how to share a Google Sheets, so your team stays in sync.

Tips for Using Google Sheets HLOOKUP

Want to make Google Sheets HLOOKUP work like a charm every time? A few smart habits can save you hours of headaches. Here’s how to get it right:

  • Use exact match (FALSE): Always use FALSE for precise results. It prevents random mismatches that can disrupt your entire sheet.
  • Keep data clean: Remove duplicates in Google Sheets before you run HLOOKUP. Clean data means reliable results.
  • Index carefully: Double-check your row index number. One wrong number and you’ll pull the insufficient data.
  • Use named ranges: Assign a name to your lookup range. It makes your formulas easier to read and update.
  • Avoid merged cells and freeze the top row: Skip merged cells, as they can confuse the HLOOKUP function. Freeze the top row so your headers stay visible while you work.
  • Combine with data validation and testing: Add data validation to control what data is entered into your sheet. Always test with a small dataset first to catch any mistakes.

Limitations of Google Sheets HLOOKUP

Google Sheets HLOOKUP is a handy tool, but it’s not magic. Knowing its limits saves you frustration in the long run. Pair it with VLOOKUP for Google Sheets or Google Sheets Artificial Intelligence to work around some of these gaps. Here’s what to watch out for:

  • Only searches horizontally: HLOOKUP scans rows, not columns. If you need a vertical search, use VLOOKUP instead.
  • Left-to-right lookup only: It can’t look left once it finds a match. Your key must be in the first row of your range.
  • Static row index: The row index doesn’t adjust if you add rows. Update it manually to avoid mistakes.
  • No partial matches: HLOOKUP needs an exact or closest full match. It can’t find part of a word or number.
  • Case insensitive & merges cause errors: HLOOKUP ignores letter case. Merged cells often break formulas. So, keep your data unmerged and straightforward to avoid issues.
  • Slower with large datasets: Big sheets can make HLOOKUP sluggish. Combine it with what-if analysis in Google Sheets to test smarter, not harder.

FAQs

How to apply HLOOKUP in Google Sheets?

  • Pick your search value.
  • Select the data range.
  • Use =HLOOKUP().
  • Enter search key, range, row index, and match type.
  • Press Enter. Get results fast.

What is the difference between VLOOKUP and HLOOKUP in Google Sheets?

VLOOKUP for Google Sheets searches columns vertically. Google Sheets HLOOKUP scans rows horizontally. Use VLOOKUP for long lists, and HLOOKUP for wide tables. Both boost Google Sheets Functionality and save time.

Wrap Up

So, why use Google Sheets HLOOKUP? It saves time. It finds what you need fast. No more endless scrolling through rows. HLOOKUP is simple but powerful. It works best with neat, wide data. Combine it with Google Sheets transpose if your rows and columns need to be flipped.

Want to pull data from other files? Use IMPORTRANGE in Google Sheets with HLOOKUP. This dynamic combo lets you connect multiple spreadsheets and retrieve exactly what you need—no copy-paste required. This setup saves time and boosts accuracy.

Are you working with a team? Learn how to share a Google Sheet to keep everyone on the same page. Real-time access means team members can collaborate without overlap. It also reduces version confusion and helps spot errors early.

Smart sheets make smart decisions possible. HLOOKUP turns raw, scattered data into clear, actionable answers. It’s a simple function, but it can uncover patterns and trends that drive results. With the right tools, even basic spreadsheets can power serious insights.

Don’t settle for messy, slow work. Try HLOOKUP today and pair it with other innovative tools like ChartExpo. Then sit back, relax, and watch your data work for you.

How much did you enjoy this article?

GSAd2
Start Free Trial!
156535

Related articles

next previous
Google Sheets10 min read

Wedding Budget Template in Google Sheets: Clear Insights

The wedding budget template in Google Sheets tracks and organizes wedding costs. This guide shows you how to set it up and stay on budget with ease.

Google Sheets11 min read

Compare Two Columns in Google Sheets: A Quick Guide

Learn how to compare two columns in Google Sheets with ease. This guide helps you spot differences, clean data, visualize results quickly, and more.

Google Sheets11 min read

Gemini in Google Sheets: Simplifying Data for Insights

Gemini in Google Sheets lets you automate tasks with simple prompts. Click here to learn how to use it, create charts, and boost productivity with expert tips.

Google Sheets13 min read

Google Spreadsheet Templates: You Can Use Today

Google spreadsheet templates simplify tracking, planning, and reporting. Click here to learn how to use them with examples, tips, visual tools, and more.

Google Sheets12 min read

Google Sheets Tips and Tricks to Work Like a Pro

Google Sheets tips and tricks help you save time and work smarter. Click here to learn quick fixes, charting tools, and smart features to boost productivity.

ChartExpo logo

Turn Data into Visual
Stories

CHARTEXPO

  • Home
  • Gallery
  • Videos
  • Services
  • Pricing
  • Contact us
  • FAQs
  • Privacy policy
  • Terms of Service
  • Sitemap

TOOLS

  • ChartExpo for Google Sheets
  • ChartExpo for Microsoft Excel
  • Power BI Custom Visuals by ChartExpo
  • Word Cloud

CATEGORIES

  • Bar Charts
  • Circle Graphs
  • Column Charts
  • Combo Charts
  • Comparison Charts
  • Line Graphs
  • PPC Charts
  • Sentiment Analysis Charts
  • Survey Charts

TOP CHARTS

  • Sankey Diagram
  • Likert Scale Chart
  • Comparison Bar Chart
  • Pareto Chart
  • Funnel Chart
  • Gauge Chart
  • Radar Chart
  • Radial Bar Chart
  • Sunburst Chart
  • see more
  • Scatter Plot Chart
  • CSAT Survey Bar Chart
  • CSAT Survey Chart
  • Dot Plot Chart
  • Double Bar Graph
  • Matrix Chart
  • Multi Axis Line Chart
  • Overlapping Bar Chart
  • Control Chart
  • Slope Chart
  • Clustered Bar Chart
  • Clustered Column Chart
  • Box and Whisker Plot
  • Tornado Chart
  • Waterfall Chart
  • Word Cloud
  • see less

RESOURCES

  • Blog
  • Resources
  • YouTube
SIGN UP FOR UPDATES

We wouldn't dream of spamming you or selling your info.

© 2025 ChartExpo, all rights reserved.