Categories
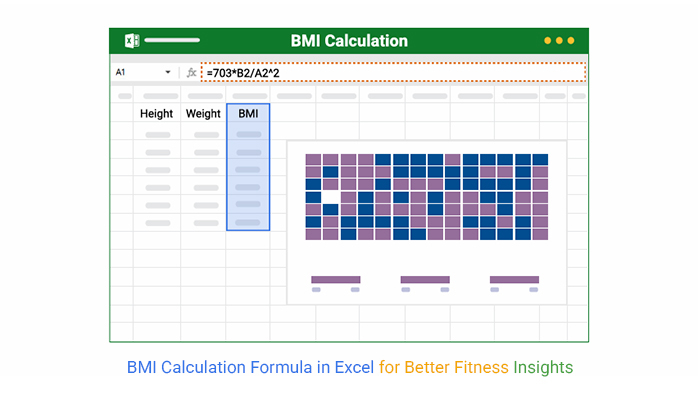
BMI calculation formula in Excel—sounds useful, right? Efficiently computing Body Mass Index (BMI) is essential for tracking fitness goals and analyzing health data.
Calculating BMI manually takes time. The formula is straightforward: weight in kilograms divided by height in square meters. However, doing this repeatedly by hand isn’t practical. That’s where Excel comes in. The BMI calculation formula in Excel automates the process and reduces errors.


Imagine tracking BMI for an entire team, company, or classroom. Instead of manually punching numbers into a calculator, Excel handles it instantly. A simple formula in a spreadsheet can calculate BMI for hundreds of entries at once. Additionally, Excel allows conditional formatting, making it easy to highlight underweight, normal, overweight, and obese categories. Using overlay graphs in Excel, you can compare BMI trends across different groups for deeper insights.
With a simple formula, data transformation in Excel helps refine BMI data for better analysis. With cool Excel charts and graphs, you can visualize BMI data more engagingly and track health metrics with ease.
Excel is powerful, and mastering this function is essential. Let’s explore how to set it up efficiently.
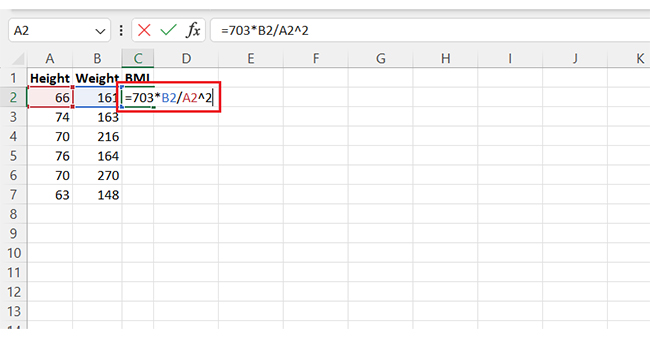
Definition: BMI in Excel refers to calculating Body Mass Index using a formula within a spreadsheet. BMI helps assess whether a person has a healthy weight for their height. The formula is simple:
BMI= (weight (lb) )/(height (inches)2)*703
Using this formula in Excel eliminates manual calculations and reduces errors. Moreover, visualizing results with a speedometer chart in Excel can make BMI categories easier to understand. It’s useful for personal tracking, health professionals, and researchers.
With Excel, analyzing BMI data becomes fast and efficient. Clear visuals and automated calculations improve health assessments significantly.
BMI helps assess weight status, but manual calculations take time. Excel speeds up the process while ensuring data integrity. Accurate formulas keep results reliable and organized. Here’s why it’s the go-to tool.
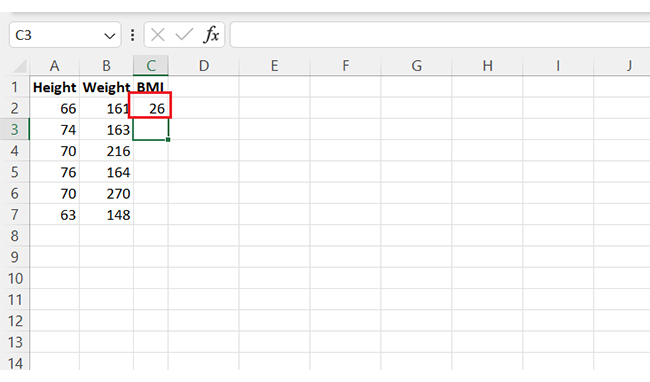
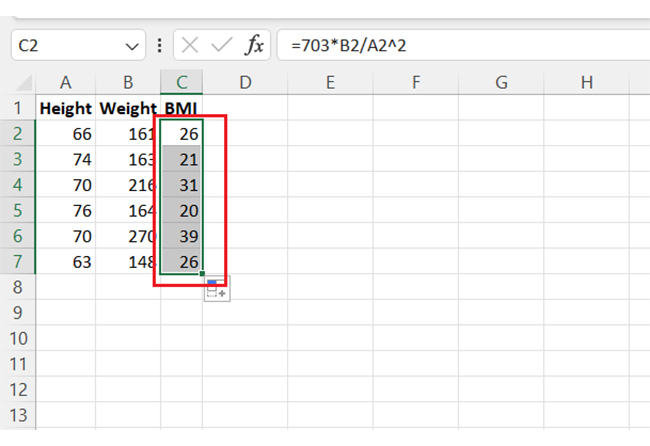
Excel has a simple formula that calculates BMI instantly. It ensures accuracy and speed when tracking personal health or managing multiple records. Moreover, having accurate data for Excel charts helps visualize BMI trends effectively.
Follow these steps to set it up effortlessly.


Spreadsheets are great for crunching numbers, but making sense of them? That’s another story. The BMI calculation formula in Excel helps track weight status, but raw numbers alone don’t reveal much.
Data visualization turns those numbers into insights, yet Excel’s built-in charts often feel essential and limiting. They lack the depth needed for accurate analysis.
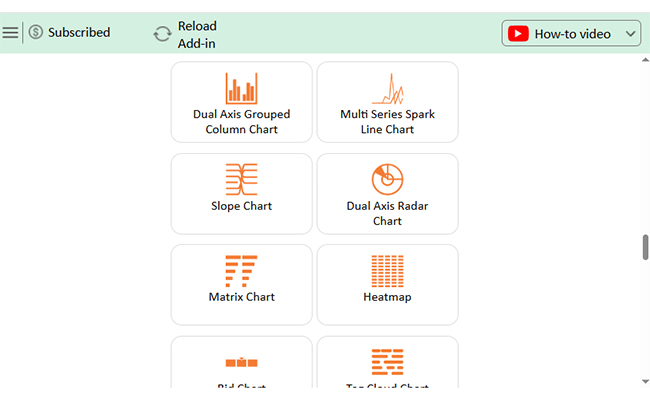
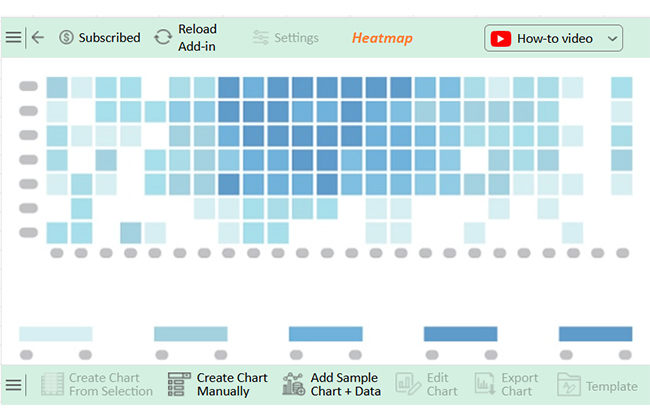
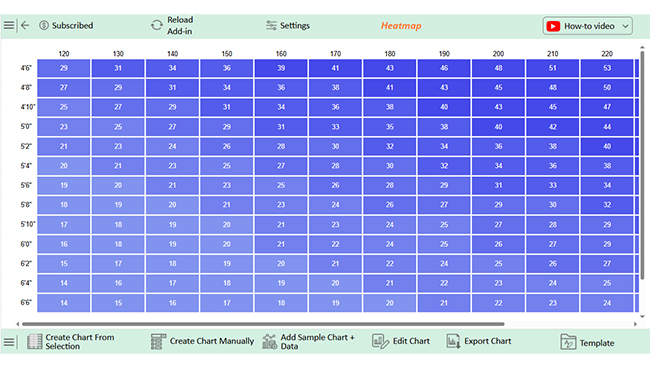
That’s where ChartExpo comes in. This robust add-in enhances Excel’s visualization capabilities, transforming dull data into clear, engaging visuals.
Let’s explore how to use BMI calculations in Excel and take it further with better charts.
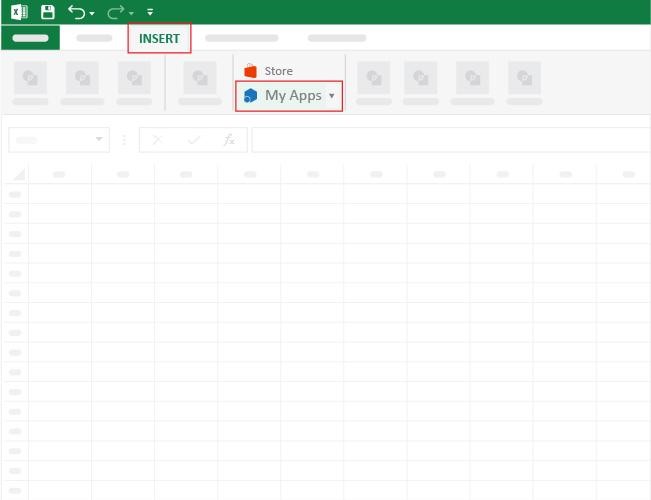
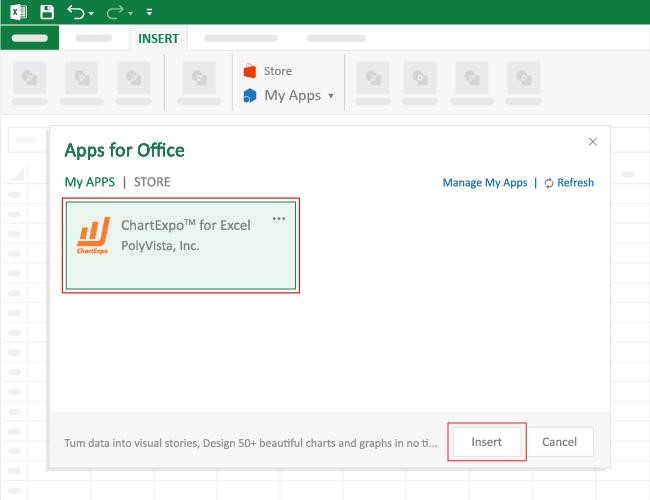
How to Install ChartExpo in Excel?
ChartExpo charts are available both in Google Sheets and Microsoft Excel. Please use the following CTAs to install the tool of your choice and create beautiful visualizations with a few clicks in your favorite tool.
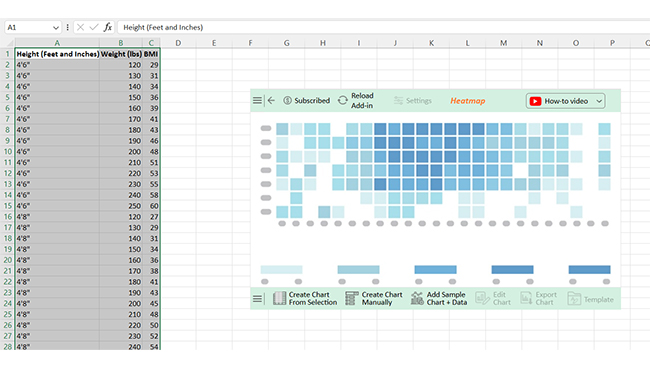
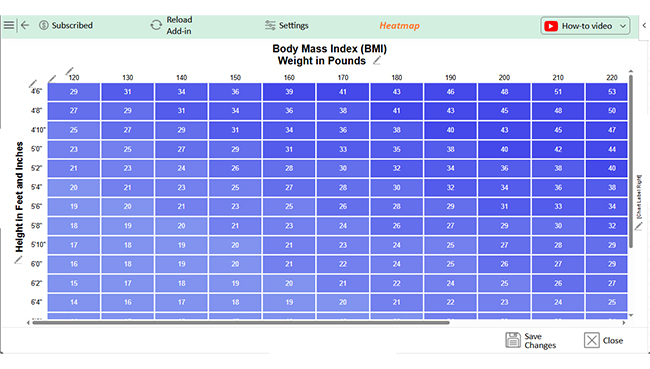
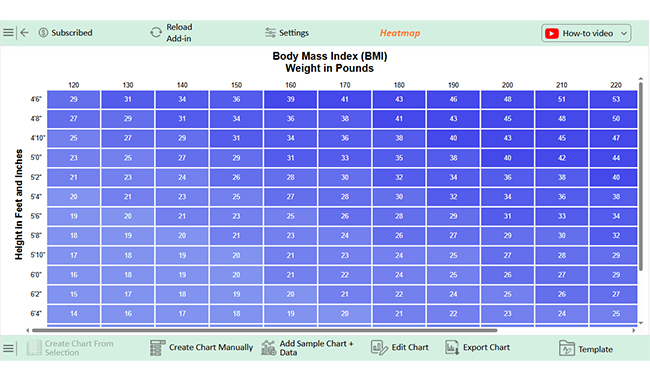
Let’s analyze this sample data and learn how to create a report in Excel using ChartExpo:
| Height (Feet and Inches) | Weight (lbs) | BMI |
| 4’6″ | 120 | 29 |
| 4’6″ | 130 | 31 |
| 4’6″ | 140 | 34 |
| 4’6″ | 150 | 36 |
| 4’6″ | 160 | 39 |
| 4’6″ | 170 | 41 |
| 4’6″ | 180 | 43 |
| 4’6″ | 190 | 46 |
| 4’6″ | 200 | 48 |
| 4’6″ | 210 | 51 |
| 4’6″ | 220 | 53 |
| 4’6″ | 230 | 55 |
| 4’6″ | 240 | 58 |
| 4’6″ | 250 | 60 |
| 4’8″ | 120 | 27 |
| 4’8″ | 130 | 29 |
| 4’8″ | 140 | 31 |
| 4’8″ | 150 | 34 |
| 4’8″ | 160 | 36 |
| 4’8″ | 170 | 38 |
| 4’8″ | 180 | 41 |
| 4’8″ | 190 | 43 |
| 4’8″ | 200 | 45 |
| 4’8″ | 210 | 48 |
| 4’8″ | 220 | 50 |
| 4’8″ | 230 | 52 |
| 4’8″ | 240 | 54 |
| 4’8″ | 250 | 57 |
| 4’10” | 120 | 25 |
| 4’10” | 130 | 27 |
| 4’10” | 140 | 29 |
| 4’10” | 150 | 31 |
| 4’10” | 160 | 34 |
| 4’10” | 170 | 36 |
| 4’10” | 180 | 38 |
| 4’10” | 190 | 40 |
| 4’10” | 200 | 43 |
| 4’10” | 210 | 45 |
| 4’10” | 220 | 47 |
| 4’10” | 230 | 49 |
| 4’10” | 240 | 52 |
| 4’10” | 250 | 54 |
| 5’0″ | 120 | 23 |
| 5’0″ | 130 | 25 |
| 5’0″ | 140 | 27 |
| 5’0″ | 150 | 29 |
| 5’0″ | 160 | 31 |
| 5’0″ | 170 | 33 |
| 5’0″ | 180 | 35 |
| 5’0″ | 190 | 38 |
| 5’0″ | 200 | 40 |
| 5’0″ | 210 | 42 |
| 5’0″ | 220 | 44 |
| 5’0″ | 230 | 46 |
| 5’0″ | 240 | 48 |
| 5’0″ | 250 | 51 |
| 5’2″ | 120 | 21 |
| 5’2″ | 130 | 23 |
| 5’2″ | 140 | 24 |
| 5’2″ | 150 | 26 |
| 5’2″ | 160 | 28 |
| 5’2″ | 170 | 30 |
| 5’2″ | 180 | 32 |
| 5’2″ | 190 | 34 |
| 5’2″ | 200 | 36 |
| 5’2″ | 210 | 38 |
| 5’2″ | 220 | 40 |
| 5’2″ | 230 | 42 |
| 5’2″ | 240 | 44 |
| 5’2″ | 250 | 46 |
| 5’4″ | 120 | 20 |
| 5’4″ | 130 | 21 |
| 5’4″ | 140 | 23 |
| 5’4″ | 150 | 25 |
| 5’4″ | 160 | 27 |
| 5’4″ | 170 | 28 |
| 5’4″ | 180 | 30 |
| 5’4″ | 190 | 32 |
| 5’4″ | 200 | 34 |
| 5’4″ | 210 | 36 |
| 5’4″ | 220 | 38 |
| 5’4″ | 230 | 39 |
| 5’4″ | 240 | 41 |
| 5’4″ | 250 | 43 |
| 5’6″ | 120 | 19 |
| 5’6″ | 130 | 20 |
| 5’6″ | 140 | 21 |
| 5’6″ | 150 | 23 |
| 5’6″ | 160 | 25 |
| 5’6″ | 170 | 26 |
| 5’6″ | 180 | 28 |
| 5’6″ | 190 | 29 |
| 5’6″ | 200 | 31 |
| 5’6″ | 210 | 33 |
| 5’6″ | 220 | 34 |
| 5’6″ | 230 | 36 |
| 5’6″ | 240 | 38 |
| 5’6″ | 250 | 39 |
| 5’8″ | 120 | 18 |
| 5’8″ | 130 | 19 |
| 5’8″ | 140 | 20 |
| 5’8″ | 150 | 21 |
| 5’8″ | 160 | 23 |
| 5’8″ | 170 | 24 |
| 5’8″ | 180 | 26 |
| 5’8″ | 190 | 27 |
| 5’8″ | 200 | 29 |
| 5’8″ | 210 | 30 |
| 5’8″ | 220 | 32 |
| 5’8″ | 230 | 33 |
| 5’8″ | 240 | 35 |
| 5’8″ | 250 | 36 |
| 5’10” | 120 | 17 |
| 5’10” | 130 | 18 |
| 5’10” | 140 | 19 |
| 5’10” | 150 | 20 |
| 5’10” | 160 | 21 |
| 5’10” | 170 | 23 |
| 5’10” | 180 | 24 |
| 5’10” | 190 | 25 |
| 5’10” | 200 | 27 |
| 5’10” | 210 | 28 |
| 5’10” | 220 | 29 |
| 5’10” | 230 | 31 |
| 5’10” | 240 | 32 |
| 5’10” | 250 | 33 |
| 6’0″ | 120 | 16 |
| 6’0″ | 130 | 18 |
| 6’0″ | 140 | 19 |
| 6’0″ | 150 | 20 |
| 6’0″ | 160 | 21 |
| 6’0″ | 170 | 22 |
| 6’0″ | 180 | 24 |
| 6’0″ | 190 | 25 |
| 6’0″ | 200 | 26 |
| 6’0″ | 210 | 27 |
| 6’0″ | 220 | 29 |
| 6’0″ | 230 | 30 |
| 6’0″ | 240 | 31 |
| 6’0″ | 250 | 32 |
| 6’2″ | 120 | 15 |
| 6’2″ | 130 | 17 |
| 6’2″ | 140 | 18 |
| 6’2″ | 150 | 19 |
| 6’2″ | 160 | 20 |
| 6’2″ | 170 | 21 |
| 6’2″ | 180 | 22 |
| 6’2″ | 190 | 24 |
| 6’2″ | 200 | 25 |
| 6’2″ | 210 | 26 |
| 6’2″ | 220 | 27 |
| 6’2″ | 230 | 28 |
| 6’2″ | 240 | 29 |
| 6’2″ | 250 | 30 |
| 6’4″ | 120 | 14 |
| 6’4″ | 130 | 16 |
| 6’4″ | 140 | 17 |
| 6’4″ | 150 | 18 |
| 6’4″ | 160 | 19 |
| 6’4″ | 170 | 20 |
| 6’4″ | 180 | 21 |
| 6’4″ | 190 | 22 |
| 6’4″ | 200 | 23 |
| 6’4″ | 210 | 24 |
| 6’4″ | 220 | 25 |
| 6’4″ | 230 | 26 |
| 6’4″ | 240 | 27 |
| 6’4″ | 250 | 28 |
| 6’6″ | 120 | 14 |
| 6’6″ | 130 | 15 |
| 6’6″ | 140 | 16 |
| 6’6″ | 150 | 17 |
| 6’6″ | 160 | 18 |
| 6’6″ | 170 | 19 |
| 6’6″ | 180 | 20 |
| 6’6″ | 190 | 21 |
| 6’6″ | 200 | 22 |
| 6’6″ | 210 | 23 |
| 6’6″ | 220 | 24 |
| 6’6″ | 230 | 25 |
| 6’6″ | 240 | 26 |
| 6’6″ | 250 | 27 |
Data democratization empowers you to access and analyze BMI trends easily. Whether analyzing personal health or managing large datasets, it streamlines the process. Here’s why Excel is the best tool for BMI calculations.
Organizing your BMI calculator spreadsheet makes tracking and analysis effortless. A well-structured sheet improves accuracy, saves time, and enhances data interpretation. Learning how to add trendlines in Excel can help visualize BMI trends effectively. We’ll not stop here. Let’s explore more tips to help you use the BMI calculator spreadsheet.


Divide weight (kg) by height (m)2 to calculate BMI. The formula is:
BMI= (weight (kg) )/(height (m)2)
For example, if the weight is 70 kg and the height is 1.75 m:
BMI=(70 )/〖1.75〗^2 = 22.86
In Google Sheets, use this formula:
=A1 / (B1 * B1)
Enter weight (kg) in A1 and height (m) in B1. This formula divides weight by the square of height. It calculates BMI automatically. Moreover, adjust cell references as needed and ensure height is in meters.
Excel makes BMI calculation simple and efficient. A single formula automates the process, reducing manual errors. Whether for personal tracking or large datasets, it ensures accuracy.
Calculating BMI manually takes time. You enter weight and height with Excel, and the formula does the rest. This speeds up health assessments and data analysis. Moreover, learning how to add a secondary axis in Excel can help you visualize multiple data sets.
Visualization helps in understanding BMI trends. However, Excel’s basic charts may not be enough. Clear, insightful visuals make data more meaningful. Businesses also use similar data analysis techniques for tracking customer lifetime value, helping them measure long-term profitability.
ChartExpo enhances Excel’s visualization capabilities. It turns raw BMI data into interactive, easy-to-read charts, making trend analysis and decision-making more effective.
Protecting formulas and formatting data improves usability. Features like conditional formatting and automated classification make BMI tracking even better. Minor adjustments lead to more efficient spreadsheets. Exploring add-ins for Excel Mac can expand functionality and improve workflow.
Excel simplifies BMI calculations, but better visualization tools take it further. Combining formulas with advanced charts improves clarity. Tracking and analyzing BMI data becomes faster, wiser, and more impactful.
Install ChartExpo to create intuitive and insightful visualizations effortlessly.
How much did you enjoy this article?


Learn how to use sparklines in Excel to quickly visualize trends inside cells. Discover types, creation steps, customization, use cases, benefits, and best practices.

Learn what a confidence interval graph is, how to create it in Excel, and how to interpret results to make more reliable, data-driven decisions.

A correlation matrix in Excel helps identify relationships between variables. Learn how to create, read, and use it for effective data analysis.


