Capture Attention.
Convey Ideas.
Clarify Complexity.
ChartExpo offers an ever-growing library of new custom charts to supercharge Microsoft Power BI data visualization.
Create advanced Power BI charts with few clicks and save yourself time.
It’s that simple. There is no coding, scripting or complicated steps — just click and create.
Free 7-day trial (no purchase necessary). Pricing starts at $10 per month.
Data visualization in Power BI is great, but it could be even better.
Whether you’re just getting started with Power BI or already a seasoned pro, you’ve encountered some obstacles. ChartExpo can help.
ChartExpo is the best Power BI custom visuals tool, offering many new Power BI chart types that you can use to take your data analysis to the next level.
With ChartExpo’s user-friendly chart creation process, creating custom visuals in Power BI is easier than ever. Oh, and you’ll save heaps of time in the process!
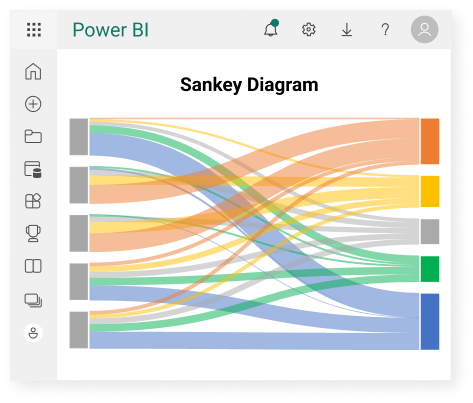
Say you want to create a Sankey Diagram in Power BI. Thanks to ChartExpo, it takes only minutes to turn raw data into a Power BI Sankey Diagram with multiple levels.
There are no confusing steps and no need to be a coding or scripting wizard. With ChartExpo, anyone can craft custom visuals in Power BI.
Use ChartExpo and empower your data analysis and visualization with Power BI.
MS Power BI is a robust program with lots to offer data users. However, your data needs are constantly evolving. New challenges require more advanced graphs in Power BI.
ChartExpo offers a large and ever-growing Power BI custom visuals gallery. These new Power BI graphs will allow you to explore your data in entirely new and exciting ways.
No matter how unique or niche your data visualization needs are, ChartExpo has the charts you need. If you don’t see the chart you need, let us know. We’ll see what we can do to develop a custom visualization in Power BI for you.
“Data” is a broad word —an umbrella term for all things related to information and analytics. This means that every team or organization defines and understands data differently.
When it comes to creating Power BI charts, everyone has their own needs and requirements. The most effective charts for one company may have little or no application in another.
This is why ChartExpo offers such a large selection of Power BI custom visualizations. There are chart options for every type of analysis. Even if you work in a niche field or have complex, multi-dimensional datasets, there are chart choices for you.
Access to more Power BI visualization types is both convenient and valuable. Not only do you have a chart for every occasion and analysis approach, but you also have the chance to extract more insights from your data.
Data and charts don’t work like Cinderella’s glass slipper. There isn’t a single perfect chart for every dataset. More likely, there are several different chart types capable of properly displaying the information.
When you visualize the same data in MS Power BI using multiple chart types, you start to gain a deeper understanding of what’s happening behind all the numbers and figures.
Essentially, each chart depicts the data in a unique way, offering a fresh perspective on the same information. ChartExpo allows you to quickly change what Power BI visualization you see, enabling you to see your data from every possible angle.
If you detect a notable shift, trend or anomaly in your data, you can dig deeper with other chart types, quickly getting to the root of the change.
Utilizing a range of chart types also helps you report and present findings to others. There may be a specific result you want audiences to pay attention to. You can select the best Power BI charts that demonstrate this intended conclusion.
In short, more chart types lead to more insights because you have more ways to visually interact with the data and derive discoveries.
In business, having all of the best Power BI visualizations at your disposal is a tremendous competitive advantage.
Most competitors rely only on the Power BI visuals readily included with the program. This restricts them from seeing some valuable market insights and trends.
Using ChartExpo’s Power BI custom visuals gallery, you can explore your data deeper than competitors, seeing what they aren’t.
This opens the door to discovering valuable opportunities and risks that other businesses simply don’t catch. You’ll be the first to capitalize on positive changes and avoid negative ones.
Being the first to act is a powerful competitive differentiator. Imagine investing in Apple stock in the 90s or having the foresight to always avoid traffic on a long road trip.
Predicting what’s around the corner is what every business strives to do. Sadly, only a small minority succeed at this objective. ChartExpo’s wide range of Power BI charts allows you to see around corners and become a proactive business, rather than a reactive one.
Reactive businesses change course after a significant change occurs. Proactive ones have the foresight to change course before that sudden shift occurs.
In the Digital Age, where data drives performance, doesn’t it make sense to utilize all of the tools possible? You don’t want to rely on the same tactics as your competitors when better ones exist.
The team behind ChartExpo has been in the data game a long time — long enough to know that data is constantly changing. This includes how and why we interact with information.
This ever-changing nature keeps our team busy creating new charts and finding ways to help clients solve their data obstacles.
It’s our mission to help you find insights today, while also solving tomorrow’s data problems.
The ChartExpo team is always paying attention to the latest trends in big data and analytics. It’s about detecting future obstacles and creating solutions before they derail our clients’ workflow.
ChartExpo demonstrates its commitment to this mission through its expansive Power BI custom visuals gallery.
While ChartExpo already offers many new chart types that users don’t get with MS Power BI alone, the library is always expanding to include new options. As data and technology evolve, ChartExpo responds by developing charts to match the latest needs.
For example, ChartExpo created its Sankey Diagram for Power BI to accommodate a growing desire to visualize more elaborate datasets. Many people required multilevel Sankey Charts in Power BI. So, we filled that need.
During the cryptocurrency boom, ChartExpo began to develop crypto charts to help investors track the values of each currency and see how their portfolios were growing.
No one has a crystal ball, but one thing is certain about the future: how you want to view and interact with your data will change. ChartExpo is here to help you navigate whatever the future may bring.
You shouldn’t need a degree in data science or analytics to use Power BI for data visualization and analysis. Unfortunately, there are times when that’s what it feels like to users.
While Microsoft offers plenty of Power BI tutorials, it can take hours to navigate these learning resources and troubleshoot your problems.
ChartExpo offers a much easier solution. It streamlines data visualization in Power BI into just three easy steps:
ChartExpo does the rest for you automatically. It’s almost like magic. This simple system makes complex data analysis a breeze, saving you lots of time and getting you valuable answers quicker.
Every organization understands the significance and value of data, but that doesn’t mean they have to enjoy it.
After all, data is cumbersome to work with and even more tedious to truly understand. In the Digital Age, there’s so much information available to businesses that it becomes overwhelming.
This is known as data overload. When you have so much data available, it becomes challenging to know where to begin. How do you make sense of all the stuff hitting your dashboards and spreadsheets daily?
The offshoot of data overload is analysis fatigue. You start unraveling the tangled yarn mess that accumulates from all your metrics and key performance indicators by asking and answering analysis questions.
Unfortunately, the typical process of transforming data into insight is just as tedious as the overload of information.
Even with tools like MS Power BI, it can take hours, even days, to answer a single analysis question. This time-consuming effort has an effect of diminishing returns. The more analysis projects you pursue, the more fatiguing it becomes.
The solution to analysis fatigue is making the process easier and more streamlined. This is what ChartExpo offers. Its 3-step approach to making charts in Power BI means you can create custom visuals in minutes rather than hours.
By making it faster and near-effortless to build custom visuals in Power BI, ChartExpo helps you quickly convert your overwhelming data coffers into actionable insights.
Finally, data can be valuable and efficient.
In the Digital Age, everyone understands that paying attention to key metrics is vital to success and growing a business.
The value of data is not lost on any organization.
However, data itself is only significant if you can convert the raw information into insight and actionable intelligence.
Moreover, the value of any insight is often dependent on the time it takes you to discover and understand it. This is why agile analysis is so crucial.
In other words, the longer it takes you to make a data discovery, the less actionable and significant it is.
It doesn’t do you much good to detect an issue after it has already grown into a larger crisis. Similarly, you want to be one of the first to notice a new market trend, not the last.
Unfortunately, many teams don’t have the agility to fully capitalize on their insights and discoveries. Again, it is a matter of being reactive versus proactive. You want to make edits to your strategies to mitigate damage before it happens, not after.
ChartExpo’s system makes it easier than ever to create Power BI Sankey Diagrams and other visualizations. Plus, with more chart types, you always have the best Power BI visuals for the job.
These two advantages provide you with today’s insights instead of yesterday’s, meaning you can always take swift, impactful action.
ChartExpo’s agile Power BI charting system has another time-related benefit.
Since you’re spending less time struggling with data, making charts and extracting insights, you have more time for everything else on your plate.
This is a common challenge for many business professionals that rely on data to perfect their strategies.
Take a pay-per-click (PPC) advertiser, for example. This is a data-intensive field, where advertisers need to pay attention to many performance metrics (clicks, impressions, CPC, search volume, quality scores, conversions… just to name a few).
On top of the data side of their responsibilities, they also need to write compelling ad copy, collaborate with the marketing department, report to stakeholders and more.
Unfortunately, monitoring PPC data is so demanding that it can become nightmarish to juggle all these duties.
Many other professional roles face a similar dilemma. There simply isn’t enough time in the day to wrangle data and perform your day-to-day tasks.
ChartExpo alleviates the pressure from these various duties by making it easier and faster to monitor data and find notable changes worth investigating.
With ChartExpo’s agile and more effective Power BI Charts, users can quickly filter out all the less-relevant data and zero in on the changes that actually matter.
Since time is such a finite resource, any chance to spend it more efficiently is a supreme advantage.
After completing an analysis project and making an insightful discovery, the information you gain is not just valuable to you alone.
The final stage in the analysis process is often to report your findings to others, like clients, stakeholders or colleagues.
These interested parties may be involved in decision-making due to the data findings. They need the proper reports to deliver insights clearly and concisely.
Remember, some of these audiences aren’t as familiar with data as you are. For instance, a marketing agency may report insights to a small business owner. That individual doesn’t have a deep background in marketing metrics and terminology.
Thus, you must be extra selective regarding which Power BI visuals you include in your reports. You don’t want to deliver overwhelming visualizations when simpler ones suffice.
ChartExpo makes it easy to save your custom Power BI charts as an image or PDF file. You can quickly attach these visuals to emails, texts or other communication channels. You can also effortlessly insert them into reports, presentations and dashboards.
This feature is incredibly valuable when you need to prepare a report or presentation very quickly.
ChartExpo is a Power BI visual tool that integrates with the software you’re already using. You don’t have to switch between tabs or have yet another program running.
You can continue using the Power BI interface you know and love. ChartExpo opens within the program and only acts to enhance your data analysis and visualization with Power BI.
We’re not asking you to learn an entirely new tool. Who has the time? We’re just suggesting you get more from the MS Power BI you already know.
Microsoft Power BI is a popular and robust data visualization tool. It includes many features, tools and settings to empower your visual analysis efforts.
That said, don’t let the powerful qualities of the data visualization Microsoft Power BI system prevent you from looking for add-ons and other tools that make the program even better.
ChartExpo adds to MS Power BI’s impressive chart gallery, giving you new visualization options to utilize. It also makes data visualization in Microsoft Power BI easier and less time-consuming.
You’re already finding insights in your data using Power BI charts. ChartExpo simply helps you see a little bit more, giving you greater benefit from the data visualization tool you’ve come to know.
Remember, it’s these “extra” discoveries that competitors and other teams are missing.
Using ChartExpo for the first time will leave you pleasantly surprised at how easy creating custom visuals in Power BI can be.
If you ever find yourself struggling in analysis or feeling overwhelmed from extracting insights, we strongly recommend checking out ChartExpo for MS Power BI.
You’ll quickly return to feeling excited about your data and insights again.
ChartExpo strives to make your daily life easier as a data and chart user. So, it wouldn’t make much sense for it to be difficult to download or integrate with your existing Power BI projects.
To get started using Power BI with ChartExpo, you have a couple of options.
You can download the entire ChartExpo interface from the Microsoft App Source. This will enable you to integrate the data visualization software into Excel, Power BI and other Microsoft tools. Alternatively, you can download some individual ChartExpo Power BI visuals.
For example, if you want to make a multi-level Sankey Power BI chart, you can find the 8-level Power BI Sankey Diagram by ChartExpo available to install and use. You’ll also use the Microsoft App Source to find this Power BI Sankey download.
The process is exceptionally straightforward to download the ChartExpo tool or any custom Power BI visuals. All you have to do is look for the Power BI custom visuals download you want and follow the prompts on your screen.
The tools or visualizations should integrate with Power BI automatically. However, you’ll need to restart the program for them to appear.
There are plenty of Power BI tutorials and guides to help you install new visuals or tools.
Arguably, downloading ChartExpo is the most substantial challenge. Once you successfully install and integrate it with your Microsoft programs, using the tool itself is incredibly easy.
The ChartExpo interface is intuitive and easy to navigate. There are no confusing settings or options to navigate. Moreover, ChartExpo doesn’t require any specialized skills or background. It is a charting tool for every user, from advanced to beginners.
The beauty of this is there is virtually no learning curve. Exploring ChartExpo’s menus and 3-step charting process takes only a few minutes.
No one likes learning a new program or interface. You want to stay with what you know. There are two reasons for this. One, we simply like what we like.
The second reason is time. Having to learn a new program puts yet another item on your to-do list, taking away from the other tasks you need to complete.
ChartExpo eliminates both challenges. It integrates with the existing MS Power BI tool you know. You don’t need to worry about a new program environment or tabbing between applications.
Plus, the user-friendly interface guarantees you can master ChartExpo in minutes. If you run into hurdles specific to Power BI advanced visualizations, sample datasets, YouTube tutorials and other resources are available.
Need a Power BI Sankey Diagram tutorial? No problem. Need to learn how to build a custom visual in Power BI with ChartExpo? There are guides and resources available for that too.
ChartExpo is dedicated to educating users on the best ways to develop Power BI visualizations and explore their data. You’ll never be without an answer.
Removing the significant learning curve that other tools require, ChartExpo has the impact to improve your Power BI data visualization efforts immensely. And, it won’t interrupt your workflow or productivity to get started.
These same benefits translate to your teams and anyone else using MS Power BI. Everyone can continue using the Power BI charts and features they love, only better.
Using ChartExpo during your daily routine also doesn’t harm your flow or work output. Since the tool integrates with Power BI, Excel, etc., you don’t need to worry about juggling multiple open programs at once.
Everything happens in the same window. There’s no endless tabbing or switching between applications.
Plus, any custom Power BI visualizations you build take only moments to appear — even the more advanced Power BI charts you make.
With this agility, you can swiftly create new Power BI visuals or change chart types in reports and other materials swiftly. The speed lets you stay on top of your data and other responsibilities while actively communicating the latest insights.
Again, ChartExpo wants you to keep your routine and how you interact with your data. We only suggest that you adopt a more effective methodology for your existing processes!
Creating custom charts in Power BI should be so easy that anyone can do it. After all, we’re in a Digital Age where charts, data and insights are all vital to success.
Sadly, this is rarely the case. Skills like programming and code writing often gatekeep effective data visualization. People without the right expertise have two options:
ChartExpo presents a third option — a tool that does the heavy lifting for you. The chart creation process is simple but doesn’t sacrifice the quality of the Power BI visualization you make.
With ChartExpo, you can give everyone on your team the ability to create beautiful, effective Power BI graphs. That’s just what you want to build the data culture necessary to thrive in the Digital Age.
While ChartExpo is not the only Power BI visual tool available to users, it is arguably one of the best Power BI visuals tools because of how easy and fast the charting system is.
Many Power BI tools and charting libraries offer new chart types at a severe cost. These tools are overly complex to use. The time it takes to create these custom Power BI visualizations dramatically diminishes their value.
The complexity of these tools often comes from their reliance on scripts and coded templates. What these tools really offer is a library of charting templates.
Editing these scripts with your data is a challenging endeavor, especially if you don’t have past experience working with coding or programming languages.
ChartExpo eliminates these unnecessary hurdles and automatically does the coding/scripting for you. It does this heavy lifting in the background; you never even have to see a line of code.
Instead, you interact with ChartExpo’s intuitive interface in MS Power BI. Any change you make to your data or chart type automatically updates the resulting visualization.
This saves tremendous amounts of time in the Power BI visualization process and makes it incredibly straightforward to make advanced charts and diagrams.
Don’t let complex settings and chart creators deter you from making exciting discoveries in your data!
Removing the need to edit and interact with coded scripts makes creating custom Power BI charts accessible to any user. You don’t have to be a trained data scientist or programmer to create compelling visualizations.
This opens the door for anyone in your organization to make charts and analyze data visually, not just the select few with the skills to utilize scripted templates.
Businesses today are increasingly trying to become data-driven in their decision-making and strategy development. This means relying on evidence and insights to make changes, rather than opinions, gut feelings or intuition.
To truly become data-driven, an organization first needs to establish a strong data culture.
What does this framework look like? Companies with solid data cultures utilize metrics in all aspects of their business.
That said, it is more than simply utilizing data. It’s a culture where teams independently pursue their own analyses and then communicate their findings and insights to other departments.
A thriving data culture is constantly collaborating and brainstorming together on the best ways to utilize data to drive positive changes. There are no silos or barriers between departments. Instead, teams share insights freely so the entire organization can thrive.
To achieve this, you need a user-friendly Power BI visualization tool like ChartExpo. Only then can you democratize insights, data and charts, giving everyone access to these invaluable tools and resources.
The alternative to democratized charting (that is to say, using a Power BI visual library that is not ChartExpo) presents several problems.
When you utilize a tool that requires coding and an understanding of programming language, you limit who in your company can effectively make Power BI custom visuals.
Everyone else has to rely on this small minority of individuals to manage visual analysis requests. Sometimes, it is just a single dedicated data scientist tasked with creating every Power BI visualization for everyone else.
This creates an obvious problem. Hundreds of chart requests may funnel through just a handful of capable individuals.
Your teams start to experience chart request traffic jams, where individuals are waiting days (if not longer) for visualizations and dashboards to appear.
Worse yet, you may find your company picking and choosing which analysis projects to prioritize, leaving some teams with no visuals to utilize in pursuing insights.
These waiting periods present a serious detriment, especially considering the fast-moving, always-changing nature of data. By the time a team receives its chart, the data may no longer be relevant. The risk or opportunity they were hoping to explore has already passed or caused damage.
By democratizing charting and allowing everyone in your teams to make their own charts, these Power BI visualization logjams disappear entirely.
The culminating power of all of these benefits (stronger data culture, more access to charting, etc.) is empowering your business decision-making.
In the past, organizations lacked enough data and analysis tools to drive accurate decisions. Instead, they relied on guesswork and assumptions.
Sometimes, these gut feelings and guesses paid off, but often they didn’t. This creates a more up-and-down growth line. Correct guesses produce steps forward, but negative ones detract from that progress.
Data and insights cut through the guesswork, resulting in consistent correct decisions. Thus, your growth line steadily climbs upwards, with far fewer wrong turns damaging your headway.
By making decisions based on data instead of opinions, you lean on proven evidence over guesses.
Even when downturns occur, you have a justification for your efforts. You can turn to stakeholders and clients and tell them, “We made this move because of these data points and this projection.”
It’s a much better (and more professional) response than, “Well, we just sort of thought it might work.”
Fueling your decisions with data over opinions also improves internal communication. Not only do you develop more trust from stakeholders, but it also limits disagreements and arguments between teams.
It’s easy for two parties to have differing opinions. This can lead to internal turmoil and dissension when two sides have varying ideas about the best strategy or decision to make.
Data provides irrefutable evidence. You can’t argue with numbers.
Every Power BI visual you create tells a story. Compelling data storytelling is vital to understanding what is happening behind all your numbers.
The best storytelling occurs when you align your data with the perfect Power BI chart type. This is when your insights rise right to the surface. But what happens when you don’t have the perfect chart type to tell your data story?
ChartExpo’s library of Power BI custom visualizations gives you more options, ensuring you always have the proper chart for any analysis project.
The bottom line: more chart types equals more insights.
In the Internet-driven era we’re living in, businesses generate mountains of data. It’s the beauty of everything happening across digital channels. Even the tiniest details produce usable data.
However, too much of a good thing becomes problematic. Many businesses find they are drowning in data but starving for insight.
In other words, they have lots of information but need more understanding of what all the numbers and figures actually mean.
ChartExpo’s Power BI visualizations aim to close this gap, enabling you to make better sense of your data and transform the raw numbers into actionable intelligence.
Charts showcase data in a manner that’s more accessible and easier on the brain. It’s the adage that a picture is worth a thousand words. When you see a chart, you can instantly comprehend hundreds or even thousands of individual data points.
There is some science behind this. Research estimates that your brain processes visual information 60,000 times faster than raw text or numbers. That’s a staggering difference.
When you combine the powerful speed of visual analysis with ChartExpo’s streamlined Power BI visualization system, it becomes incredibly efficient to begin converting the mountains of data you have into actionable insights that fuel better decision-making and strategies.
Insights offer more value than raw data. That said, there are different levels or degrees of insight.
Simple insights only offer a basic understanding. They tell you something about your data you didn’t already know. While it is always nice to expand your knowledge about the data, knowledge alone is only valuable if you put it into action.
Thus, actionable insights are the most sought-after (and also the most challenging to detect). This means a discovery that directly leads to an action to improve or preserve your performance.
Here is a simplified breakdown:
The process to take data discoveries from basic understanding to action requires you to dig deeper into each insight you uncover. To do this, you need Power BI advanced visualizations. You can’t rely on typical bar graphs or line charts exclusively.
Let’s say you discover that your website traffic is increasing dramatically. This is excellent news, but only a rudimentary insight.
Your next objective is to find out how or why website traffic has improved so much. You may find out that your recent social media posts are garnering high levels of engagement, resulting in the increased site visitors.
This is a more advanced insight, but it still isn’t actionable yet. To reach this final step, you need to investigate what made the recent posts so attractive to the audience.
Then, you can apply what you learn from analyzing these successful posts to improve future social media tactics, thereby continuing to convert these audiences into site traffic.
ChartExpo’s broad spectrum of different Power BI chart types ensures that you have every visualization you need to turn simple insights into action.
Most of the time, your data behaves normally, meaning the results are predictable and expected. This isn’t always the case. Data is constantly fluctuating. At times, it won’t behave the way you expect or predict!
Trends, shifts, anomalies and other patterns indicate when data changes in a notable or significant way.
A trend occurs when multiple data points in a row climb or fall below the standard performance line. It can highlight when a strategy, item, campaign, etc., is gaining or losing performance.
Shifts happen when there is a sudden jump or dip in performance that sustains over several data points. These can represent significant changes in your data that need to be analyzed further.
Outliers are a tricky data pattern. They represent anomalous data points that fall well beyond the norm. Data will always fluctuate to some degree, but outliers demonstrate significant deviations from expectations.
Theoretically, you can spot these patterns in a raw spreadsheet, but charts are where they truly come alive.
One look at a Sparkline chart and you can spot every shift or trend in performance. Similarly, clusters of data in a dot plot help you recognize anomalies or outliers with ease.
Thanks to ChartExpo’s impressive Power BI custom visuals gallery, you have everything from Power BI Sankey Diagrams to Pareto Charts, Dot Plots and beyond.
You’ll never miss another trend, shift or outlier again.
The result of detecting the aforementioned data patterns (trends, shifts, outliers, etc.) is the ability to mitigate risks and capitalize on opportunities actively.
A risk in data presents a change where your inactivity will negatively impact your overall performance.
Alternatively, if you fail to act on an opportunity, you miss the chance to positively improve your results.
Again, timing is a crucial factor. You want to catch a trend or shift before or as it is happening. This enables you to take proactive steps to improve performance or mitigate potential loss.
Let’s put some numbers behind this concept. Say you’re an online advertiser targeting specific keywords to drive site traffic and revenue. Suddenly, your cost per acquisition for a particular ad campaign spikes from $0.30 to $7.00.
Without the proper Power BI visuals to help you detect this jump, you’re spending 2,333% more for every new conversion. That poses a substantial risk to your profits.
For every day (even every hour) that this shift goes undetected, you continue to lose money.
ChartExpo’s Power BI graphs help you stay ahead of your data. Each time you build a custom visual in Power BI, it will make monitoring your data and detecting potential risks and opportunities easier.
You establish an unbeatable competitive advantage by proactively mitigating risks and seizing promising moments in your data.
Sankey Diagram for
Power BI Pricing