Categories

What are dynamic tables in Excel, and why do they matter? Excel remains a cornerstone for managing and analyzing
information in today’s data-driven age. Dynamic tables are a powerful tool. They make it easier to organize,
filter, and analyze data precisely.
Imagine handling a spreadsheet with thousands of rows. Static tables often need to be longer when data changes
or expands. This is where dynamic tables shine. They adapt automatically, saving time and reducing errors.
Whether tracking sales figures or analyzing trends, these tables ensure your data stays updated without manual
intervention.


Statistics back this up. Studies show that nearly 70% of professionals rely on spreadsheets for decision-making.
Yet, many spend hours adjusting their data manually. Dynamic tables in Excel can cut that time significantly,
allowing for more focus on insights rather than tedious updates.
Dynamic tables aren’t limited to large-scale projects. Even for smaller tasks, they provide flexibility.
Features like structured references and automatic formatting streamline processes. This tool is a game-changer
if you’ve ever struggled to keep your formulas accurate as data shifts.
Businesses today need efficiency. Dynamic tables make it possible to handle growing datasets while maintaining
accuracy. From financial models to project trackers, they simplify workflows across industries.
It’s clear; Excel’s dynamic capabilities aren’t just helpful but essential for staying ahead. So, let’s explore
how dynamic tables can transform how you work with data.
First…
Definition: Dynamic tables in Excel are innovative tools for managing data. They automatically
adjust as you add or remove entries. Unlike static tables, they grow or shrink to fit your data. With this, you
save time and prevent errors.
Features like automatic formatting and structured references make data handling easier. Dynamic tables simplify
tasks like sorting, filtering,
and creating charts. They’re perfect for professionals working with changing datasets, making Excel more
efficient and reliable for business or personal use.
The answer lies in making work easier, faster, and smarter. Dynamic tables are solutions for managing simple
lists or analyzing complex datasets. They adapt seamlessly to changes, saving time and boosting accuracy. Let’s
explore five reasons why they’re so valuable.
Definition: An Excel dynamic table range automatically adjusts to fit your data. It expands or
contracts as you add or remove entries. Unlike fixed ranges, dynamic table range eliminates the need for manual
updates. It is perfect for managing growing datasets or constantly evolving information.
Dynamic ranges are used in formulas, charts, and reports to ensure accuracy. They’re created using Excel tables or
dynamic named ranges. This feature lets your data stay organized and responsive, saving time and reducing
errors.
Pivot Tables are a game-changer. They’re powerful, flexible, and easy to set up. Follow these quick steps to
create one in Excel:


Want to make your data work smarter, not harder? Excel formulas help you create dynamic tables with ease. Here’s
how to get started:


Data analysis
is all about turning numbers into stories. But let’s face it—Excel isn’t exactly the life of the party when it
comes to visuals. It’s great for crunching numbers, but its charts feel outdated and limited.
Enter dynamic tables. These tools can help you organize data, but they have limits in creating eye-catching
visuals. That’s where ChartExpo steps in. This powerful add-on supercharges Excel with insightful, interactive
data
visualizations, transforming raw data into clear insights.
The charts and graphs below, including a Waterfall chart, were created using ChartExpo:


Let’s learn how to install ChartExpo in Excel.
ChartExpo charts are available both in Google Sheets and Microsoft Excel. Please use the following CTAs to
install the tool of your choice and create beautiful visualizations with a few clicks in your favorite tool.
Let’s analyze this sample data in Excel using ChartExpo, a powerful tool for analyzing and interpreting data to uncover actionable
insights.
| Period | Cash Flow (in thousand USD) | Discount Rate | Discount Factor | Discounted Cash Flow |
| Y-2019 | 145 | 6.77 | 0.288 | 42 |
| Y-2020 | 138 | 6.77 | 0.27 | 37 |
| Y-2021 | 131 | 6.77 | 0.253 | 33 |
| Y-2022 | 102 | 6.77 | 0.237 | 24 |
| Y-2023 | 112 | 6.77 | 0.171 | 19 |
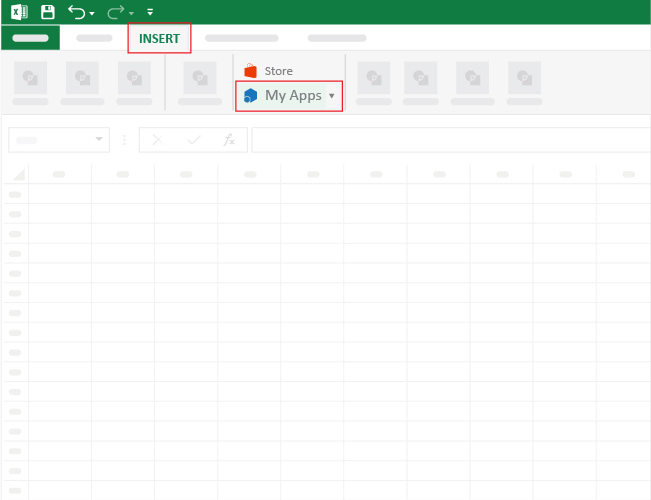
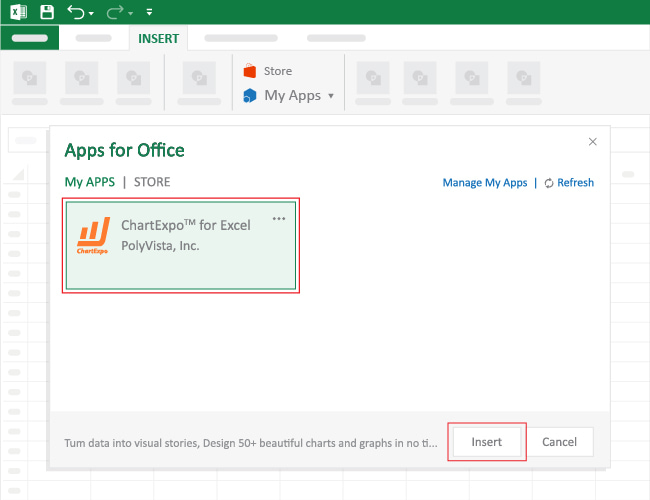


The following video will help you to create a Multi Axis Line Chart in Microsoft Excel.
A dynamic Pivot Table in Excel updates automatically as your data changes. It helps summarize, analyze, and
organize large datasets efficiently. With fields you can drag and drop, it’s a powerful tool for flexible and
interactive data analysis.
To create a dynamic function in Excel, use formulas like INDEX, MATCH, or OFFSET combined with named ranges.
Pair them with Table formatting for automatic updates. Dynamic Array functions like FILTER and UNIQUE also
enable seamless, flexible calculations.
Dynamic tables in Excel are powerful tools for managing data. They simplify and streamline the management of
large or dynamic datasets, offering adaptability that saves time and effort.
These tables automatically expand or shrink with your data. This eliminates the manual adjustments, ensuring
your work remains accurate and organized.
Dynamic tables improve clarity. Features like structured references and automatic formatting make data easier to
read and use. It enhances productivity and reduces confusion.
They also enhance reporting. Dynamic tables connect seamlessly with charts and pivot tables. Updates in your
data are instantly reflected in reports and dashboards.
Dynamic tables make data analysis and validation simpler and more efficient. Sorting, filtering, and conditional
formatting are more efficient. They streamline workflows and help identify trends quickly.
Dynamic tables are essential for modern Excel users. They enhance data management and improve accuracy, making
Excel more efficient and user-friendly for simple tasks and complex projects. Start using them today with
ChartExpo to improve and revolutionize how you work with data.
How much did you enjoy this article?


What is a workout tracking spreadsheet? It’s a tool for tracking progress, monitoring goals, and optimizing your fitness routine. A workout tracking spreadsheet helps you organize your exercises and provides clear insights into your performance.

Are you tired of feeling like you got ripped off every time you make a purchase? Do you wish there was an easy way to compare prices and find the best deals?

What is dynamic graph Excel? Dynamic graphs automatically update as your data changes, saving time and ensuring accuracy. 81% of businesses use Excel for financial reporting.